Incidents and Impact
The Incidents and Impact tab focuses on high-level metrics surrounding your incidents and their impact on your business. You can pivot on incident data through impacted functionalities, see the distribution of incident severities over time, or quickly see your most impacted services according to your date range and resolution.
Things to Note When Browsing Charts:
- We do not include
GAMEDAYorMAINTENANCEincidents in any of the charts or metrics on this page, and some charts do not include additional pieces of data. - A single incident can have multiple impacted components, and the infrastructure charts count each component's impact separately. So, there may be instances where the total count of component impacts exceeds the number of incidents.
Incidents by Infrastructure
Understanding where you have the most incidents is critical for any business. This chart allows you to see how incidents are distributed across your services or functionalities to identify where there are areas of improvement to invest.
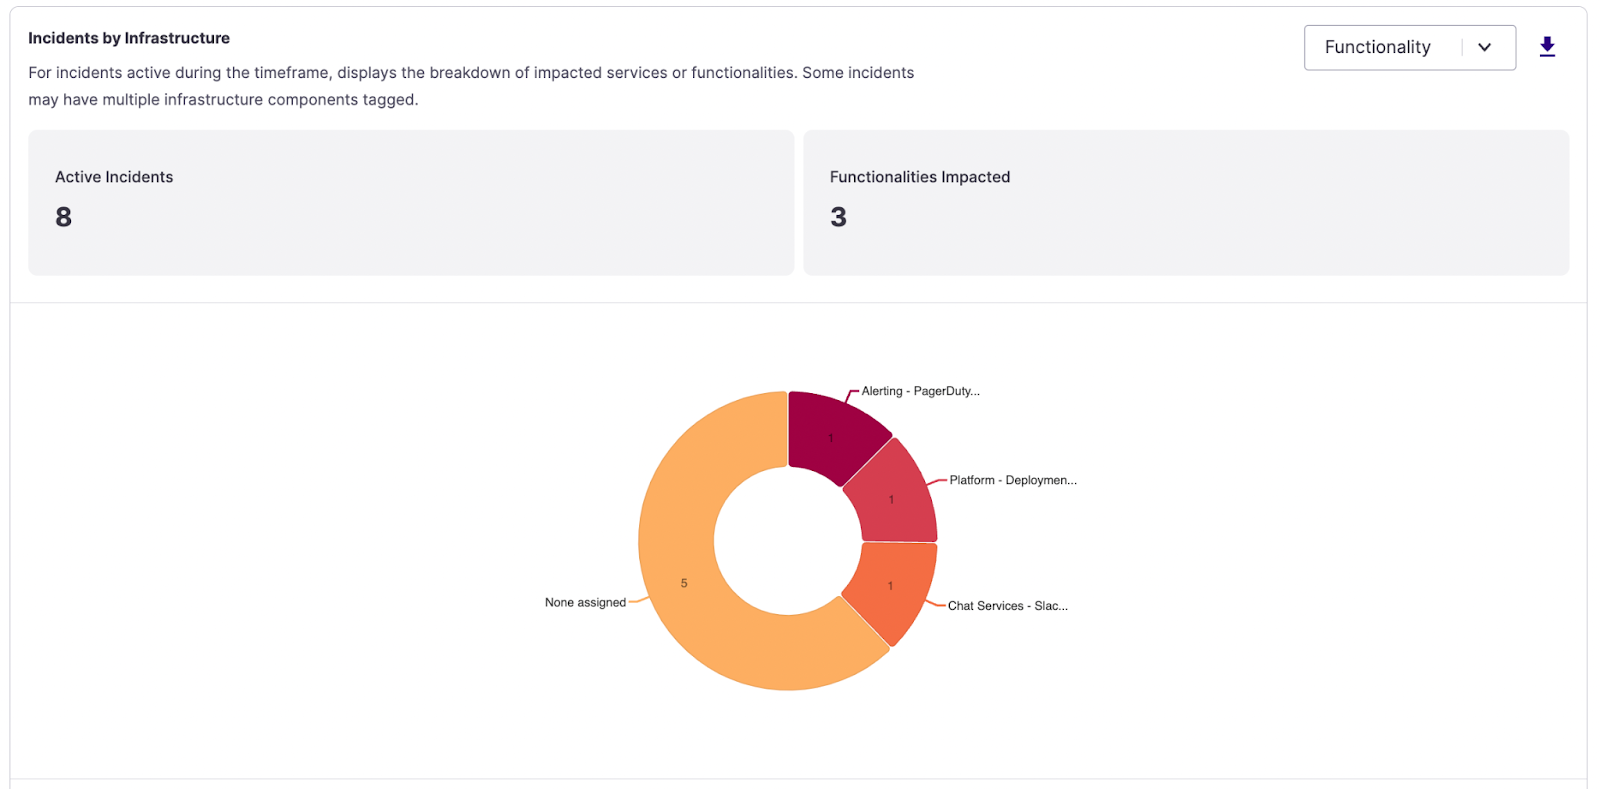
Incidents by Infrastructure donut chart
- Active Incidents - The count of active incidents (any Milestone between Started and Mitigated) within this time period.
- Functionalities / Services Impacted - Count of Services or Functionalities impacted. We do not count the 'None assigned' category.
New Incidents by Impacted Infrastructure
One of the most important ways to understand the health of your system is to look at the trends over time for each of the services and functionalities in that system. Based on your resolution, this chart shows the incident occurrence against days, weeks, or months.
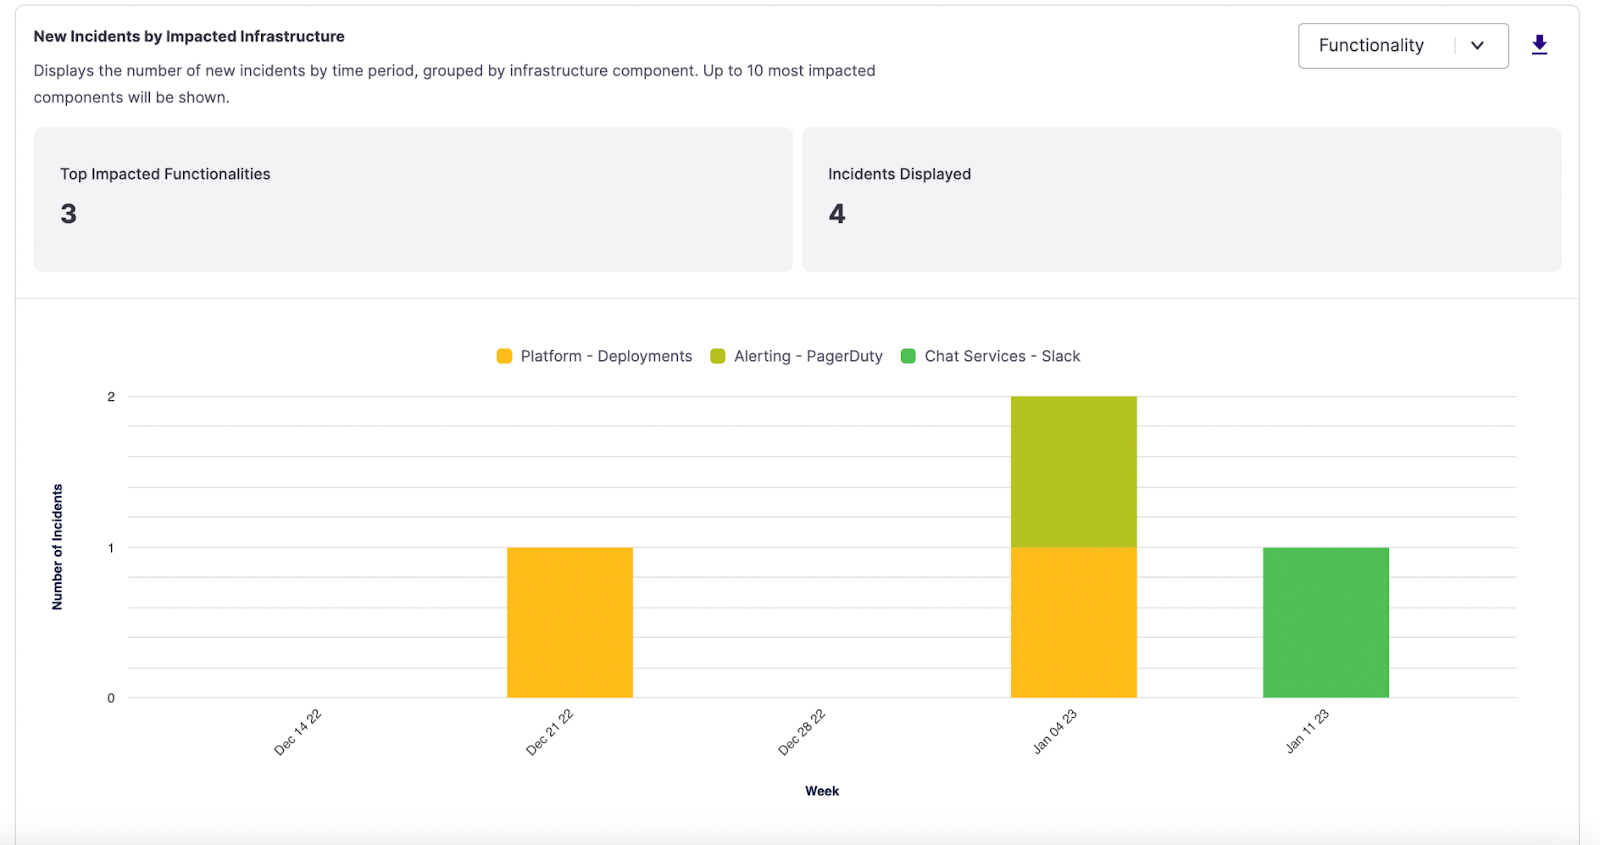
New Incidents by Impacted Infrastructure stacked bar chart
- Top Impacted Functionalities/Services - Counts the number of impacted functionalities/services displayed in the chart. We limit the graph to the top 10 impacted infrastructure components in case there are more.
- Incidents Displayed - Counts the incidents created during the specified date range, omitting any GAMEDAY, MAINTENANCE, or incidents not associated with the Top Impacted Functionalities/Services. The total here does not include ongoing incidents that were declared before the start of the date range.
New Incidents by Severity
This chart focuses on the organization's overall performance by charting incident occurrences and their severities against your chosen resolution.
For this chart, we are looking specifically at New Incidents created during the selected date range. This chart is fundamental to see when issues were introduced, allowing you to tie the information back to a release cycle or specific point in time.
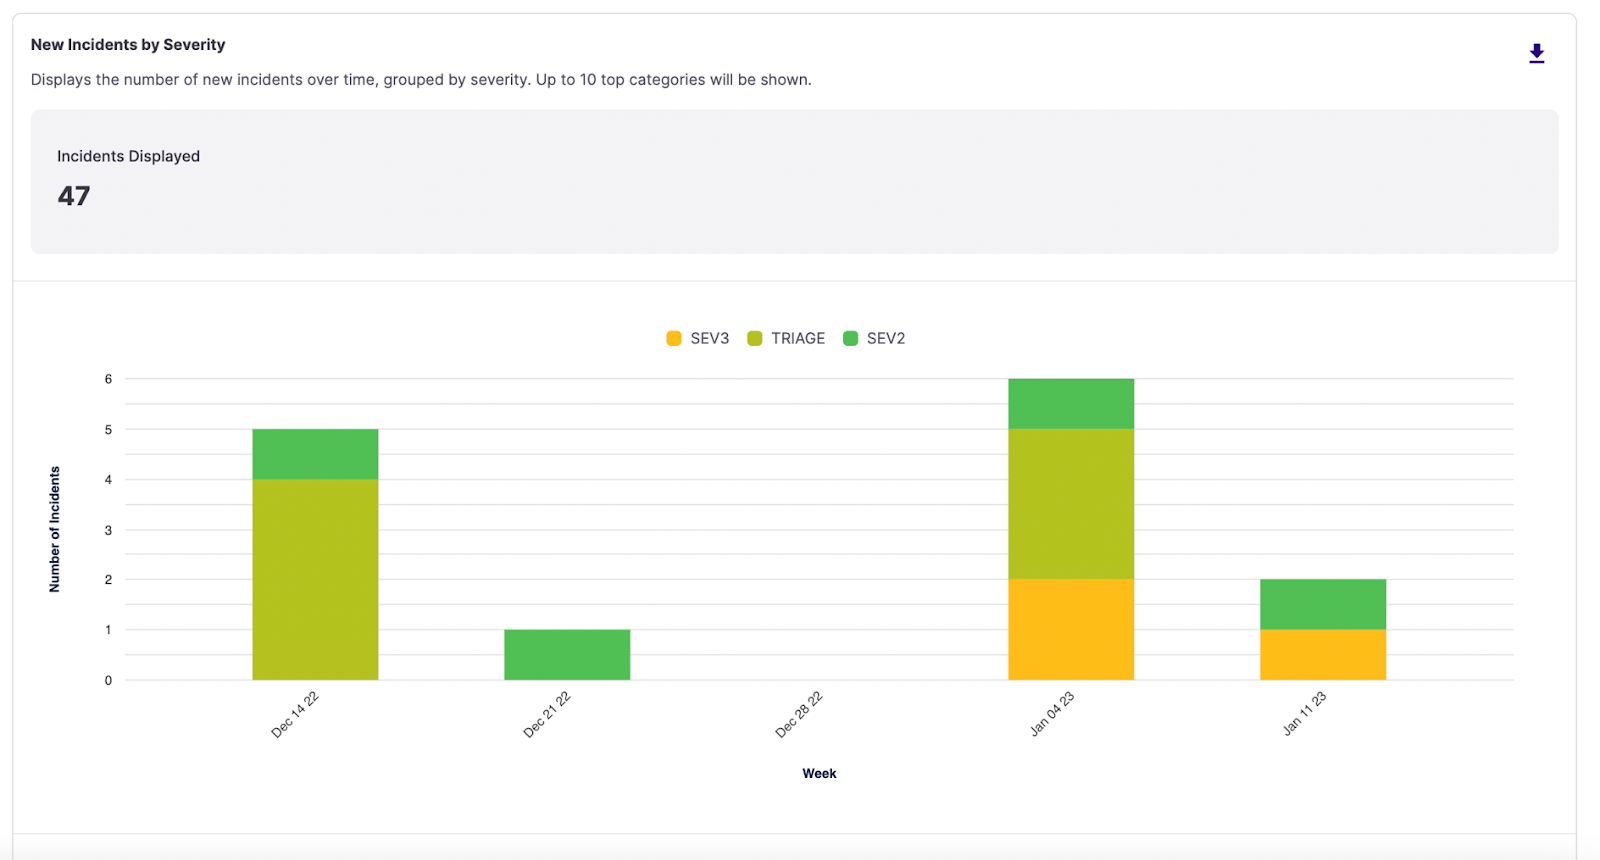
New Incidents by Severity stacked bar chart
- Incidents Displayed - Counts the incidents created during the specified date range, omitting any
GAMEDAYorMAINTENANCEincidents. The total here does not include ongoing incidents that were declared before the start of the date range.
This chart is a great place to leverage additional filters to isolate trends in specific infrastructure components and identify potential trends. You may want to understand if older services have more frequent but lower severity incidents, providing supporting data for refactoring or deprecation work. Use this chart as a starting point to dig deeper and surface questions for retrospective analysis.
Mean Time Metrics
Time is of the essence when you are working through an incident. Mean time metrics (time to detect, acknowledge, mitigate, and resolve) are standard measurements to track how efficiently your teams move through incidents, providing insights into your incident management process and potential bottlenecks.
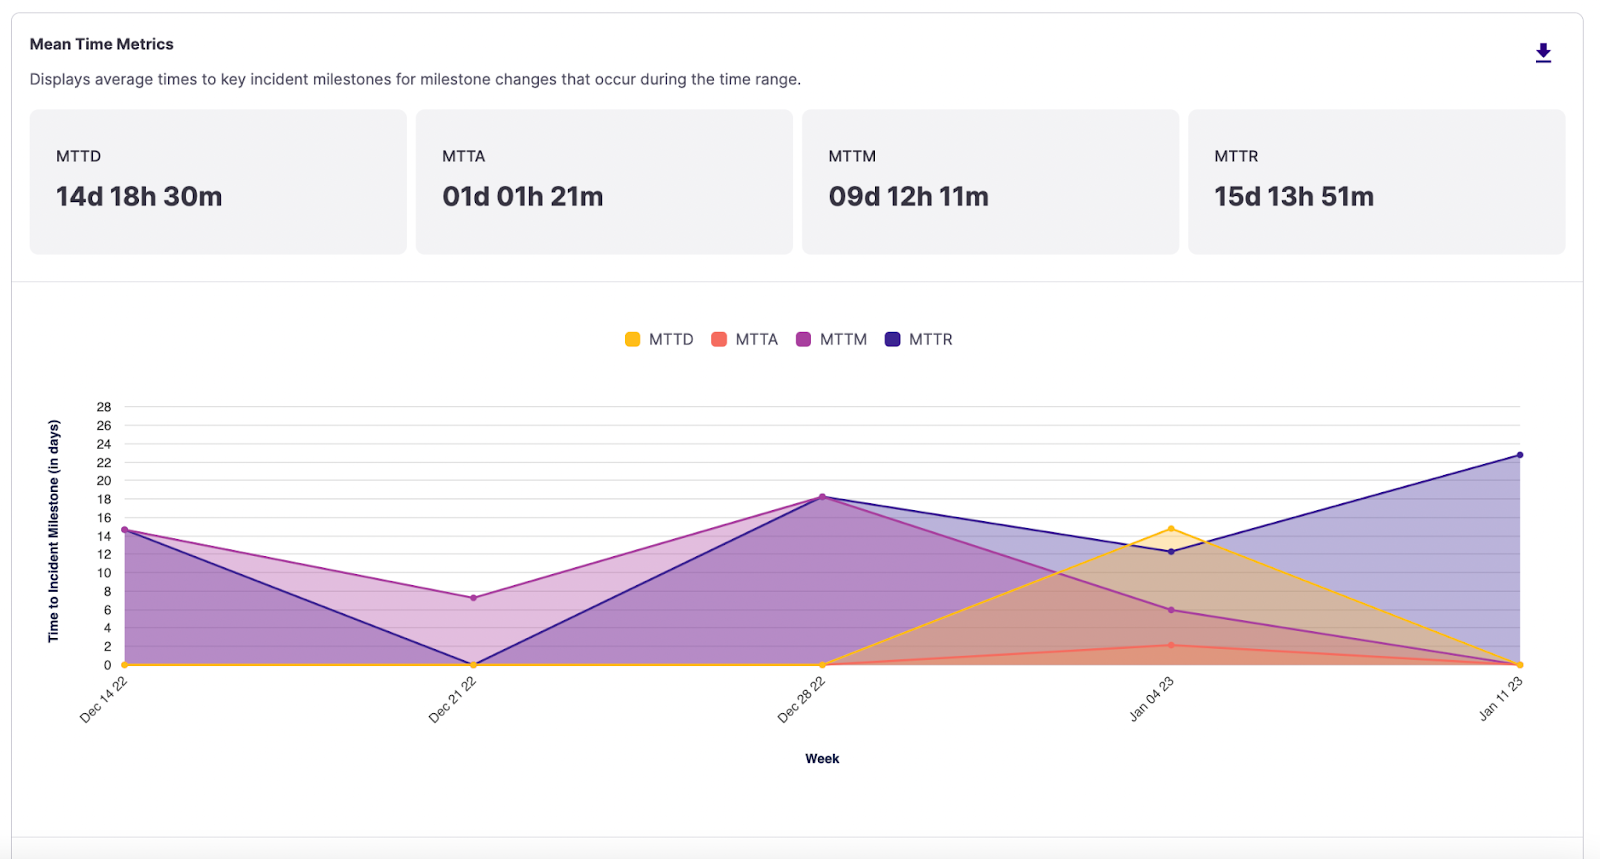
Mean Time Metrics area chart
The general calculation for each milestone is:
.](https://files.readme.io/c15fa6f-CodeCogsEqn_1.png)
The average time from Started to a specific milestone for all incidents in the given range (except GAMEDAY and MAINTENANCE incidents). Read more about Incident Milestones here.
- MTTD (Mean Time To Detected) - This metric gives insight into the timeliness of your alerts. If no alert is associated with an incident, the Detected milestone remains null unless manually set by a responder. Only incidents with a Detected timestamp are included in this calculation.
- MTTA (Mean Time To Acknowledged) - This metric can tell you how efficiently you get an initial set of eyes on an incident. Any incidents declared manually automatically start at Acknowledged milestone, so the value will be considered "0" for those.
- MTTM (Mean Time To Mitigated) - This metric provides insight into the incident's span of impact, or how long the outage or degraded service impacted customers. This metric can unearth bottlenecks leading to longer mitigation times or potential shipping/deployment issues.
- MTTR (Mean Time To Resolved) - This metric shows the overall time your team invests into incident response and resolution. Given that so many teams are involved in resolution, this could be a metric that your organization rallies around to improve consistently, setting different target SLAs for varying severities.
Incident Resolution
Another vital piece of understanding the health of your incident response program is whether you are resolving incidents as they come in or if your team is accumulating a backlog of lingering incidents. You may want to understand if older services are impacted less frequently yet still have many outstanding incidents to resolve. We surface this supporting data for refactoring or deprecation work.
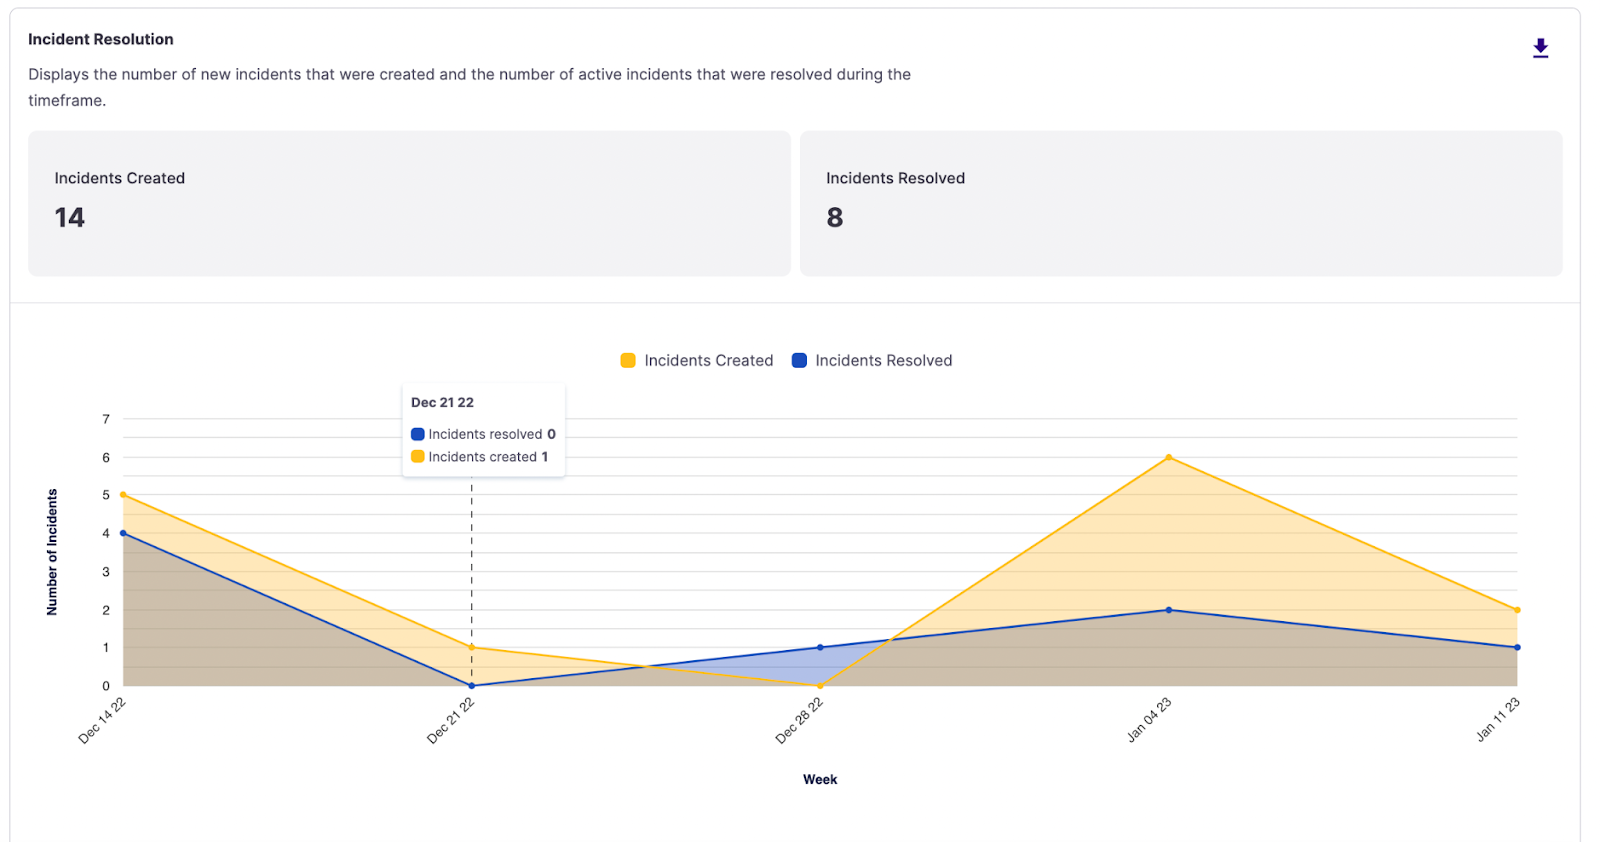
Incident Resolution area chart
- Incidents Created - Counts the number of new incidents declared during the selected date range within the filtering criteria.
GAMEDAYandMAINTENANCEincidents are omitted. - Incidents Resolved - Counts the incidents resolved during the selected date range.
GAMEDAYandMAINTENANCEincidents are omitted. Note that if an incident were declared before the time range and resolved within the time range, it would still be counted, leading to a potential mismatch between the number of incidents declared vs. resolved.
Next Steps
Read about the other Analytics pages:
Updated 4 months ago