Alerting Analytics
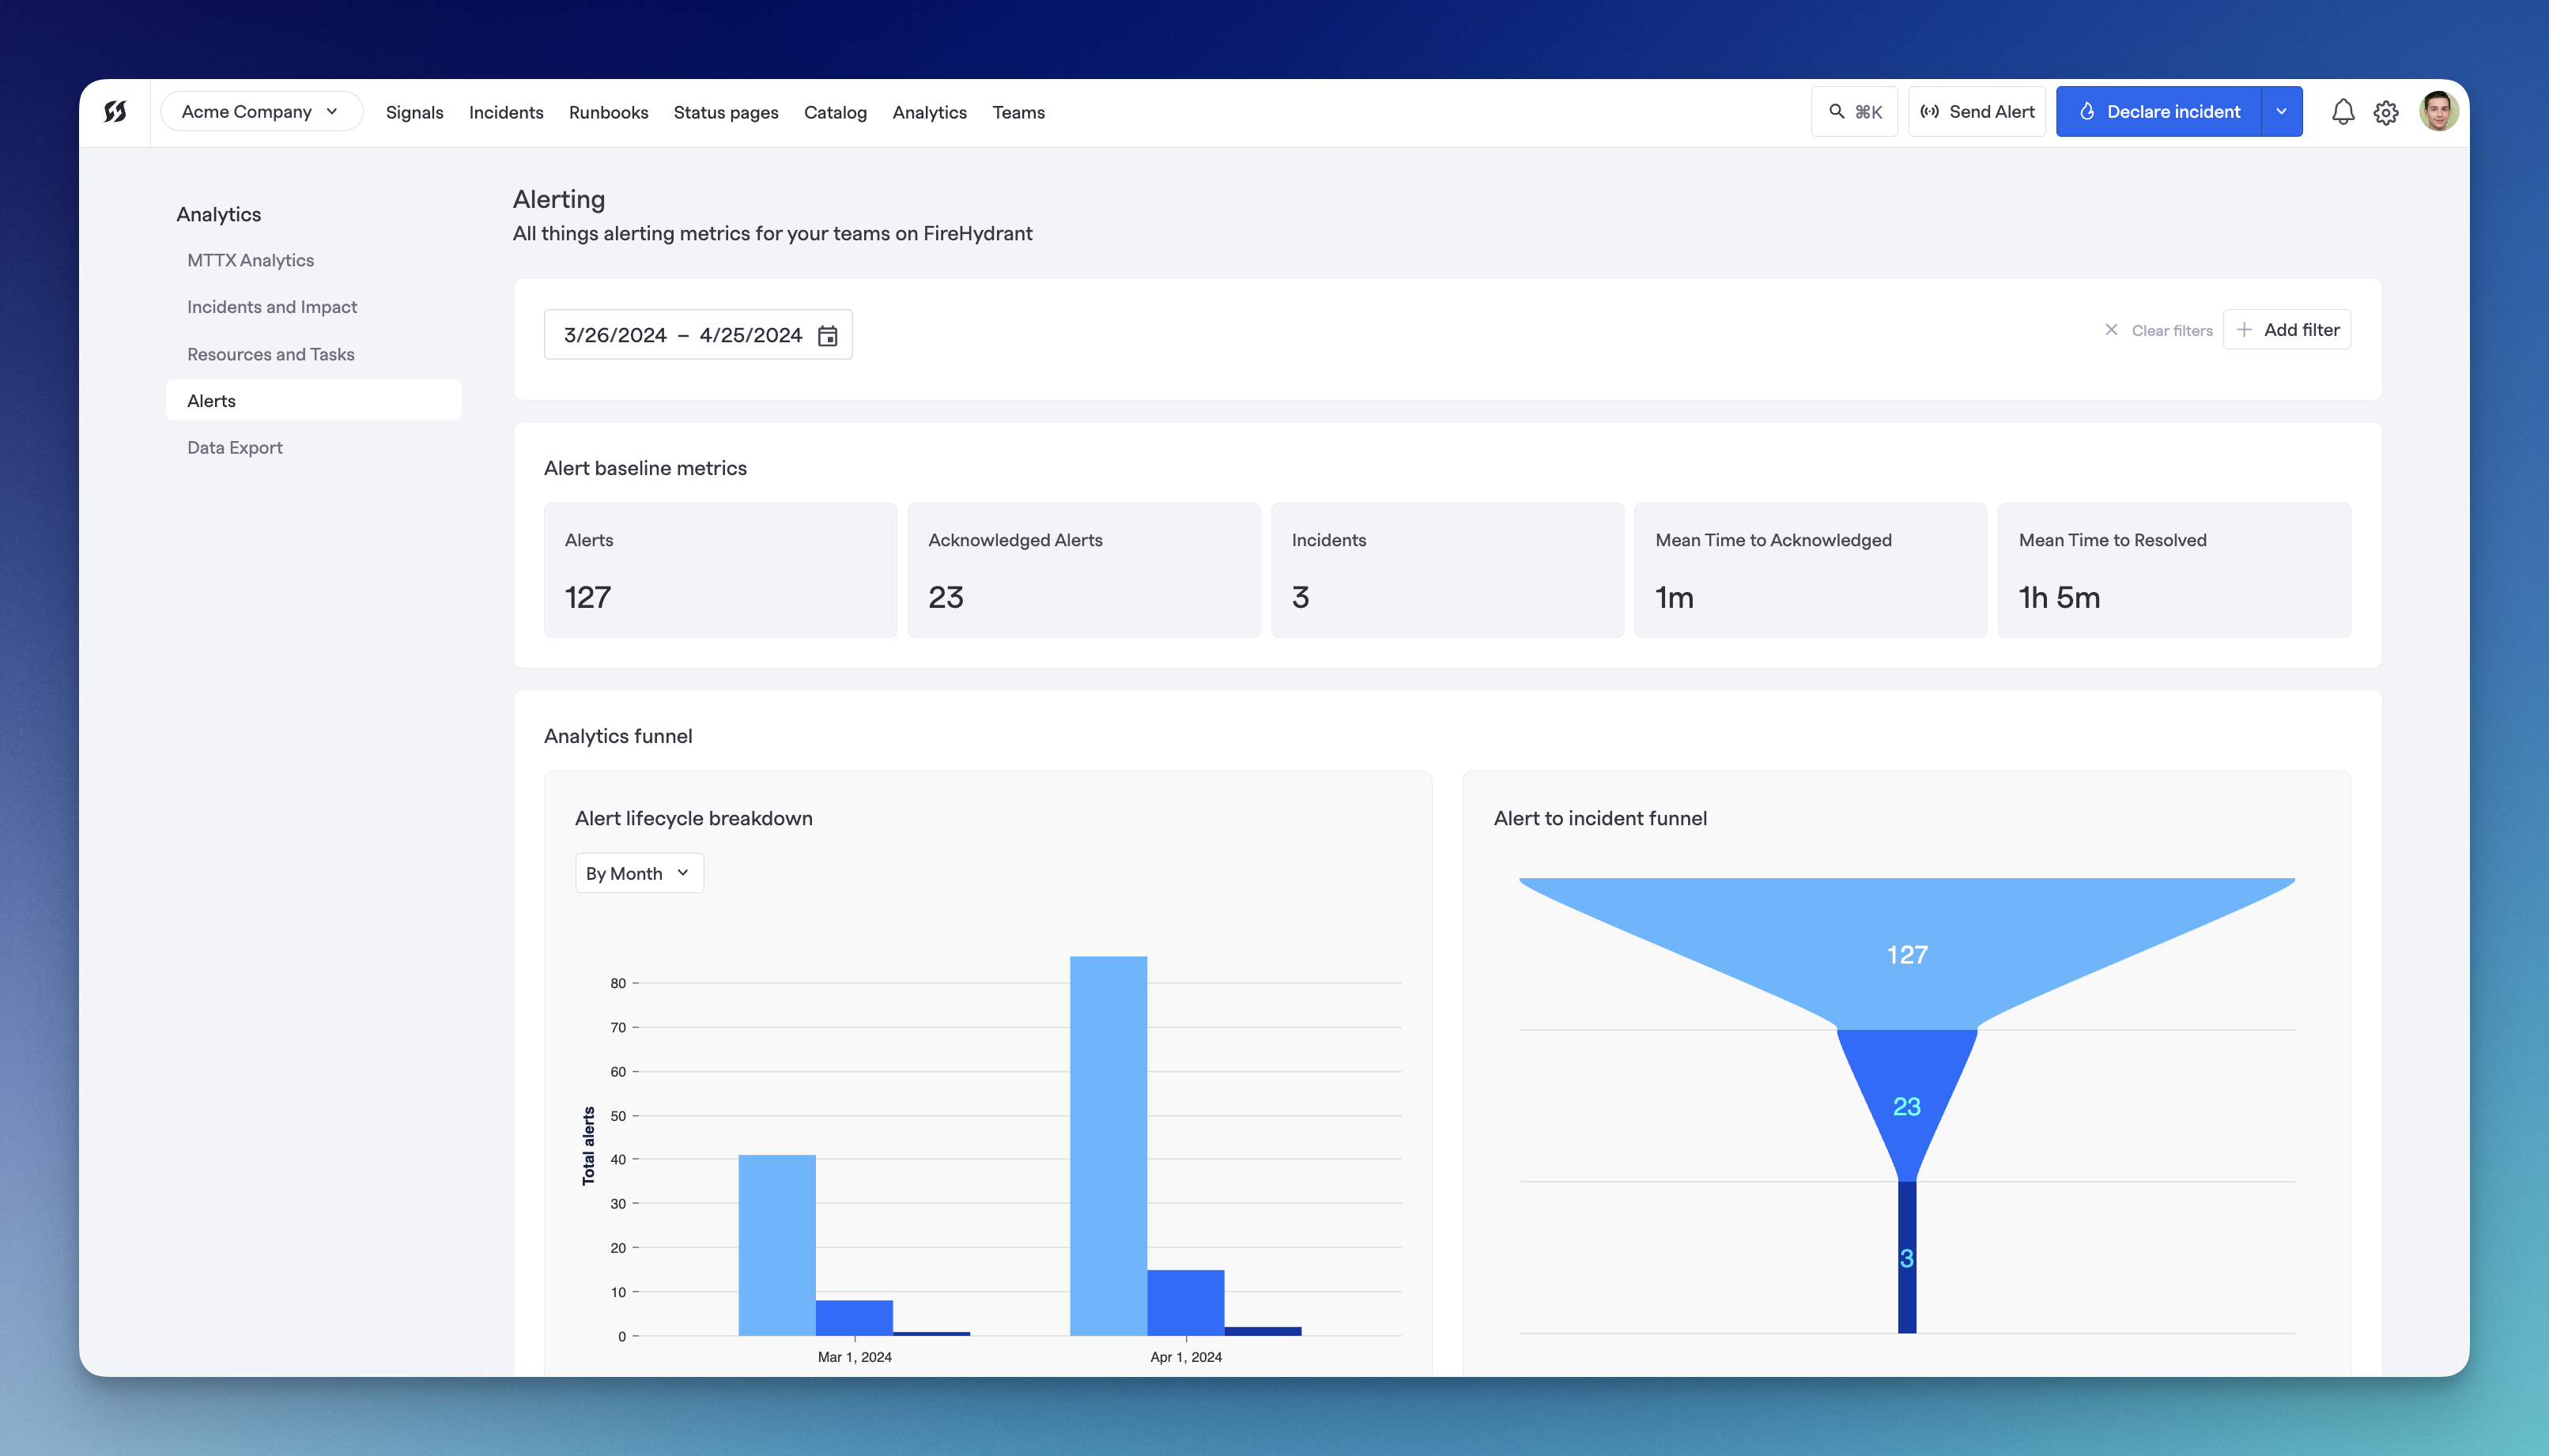
FireHydrant offers key Alerting metrics to help responders understand the overall health of their monitoring and teams.
Alert baseline metrics
The baseline metrics show the total number of alerts, acknowledgments, and incidents that resulted from these alerts. We also calculate the MTTA and MTTR metrics of Alerts.
These metrics are calculated across all alerts according to the configured filter at the top of the page. You can adjust and finetune the filter by various parameters, including specific components, teams, matching Rules, and more.
Analytics funnel
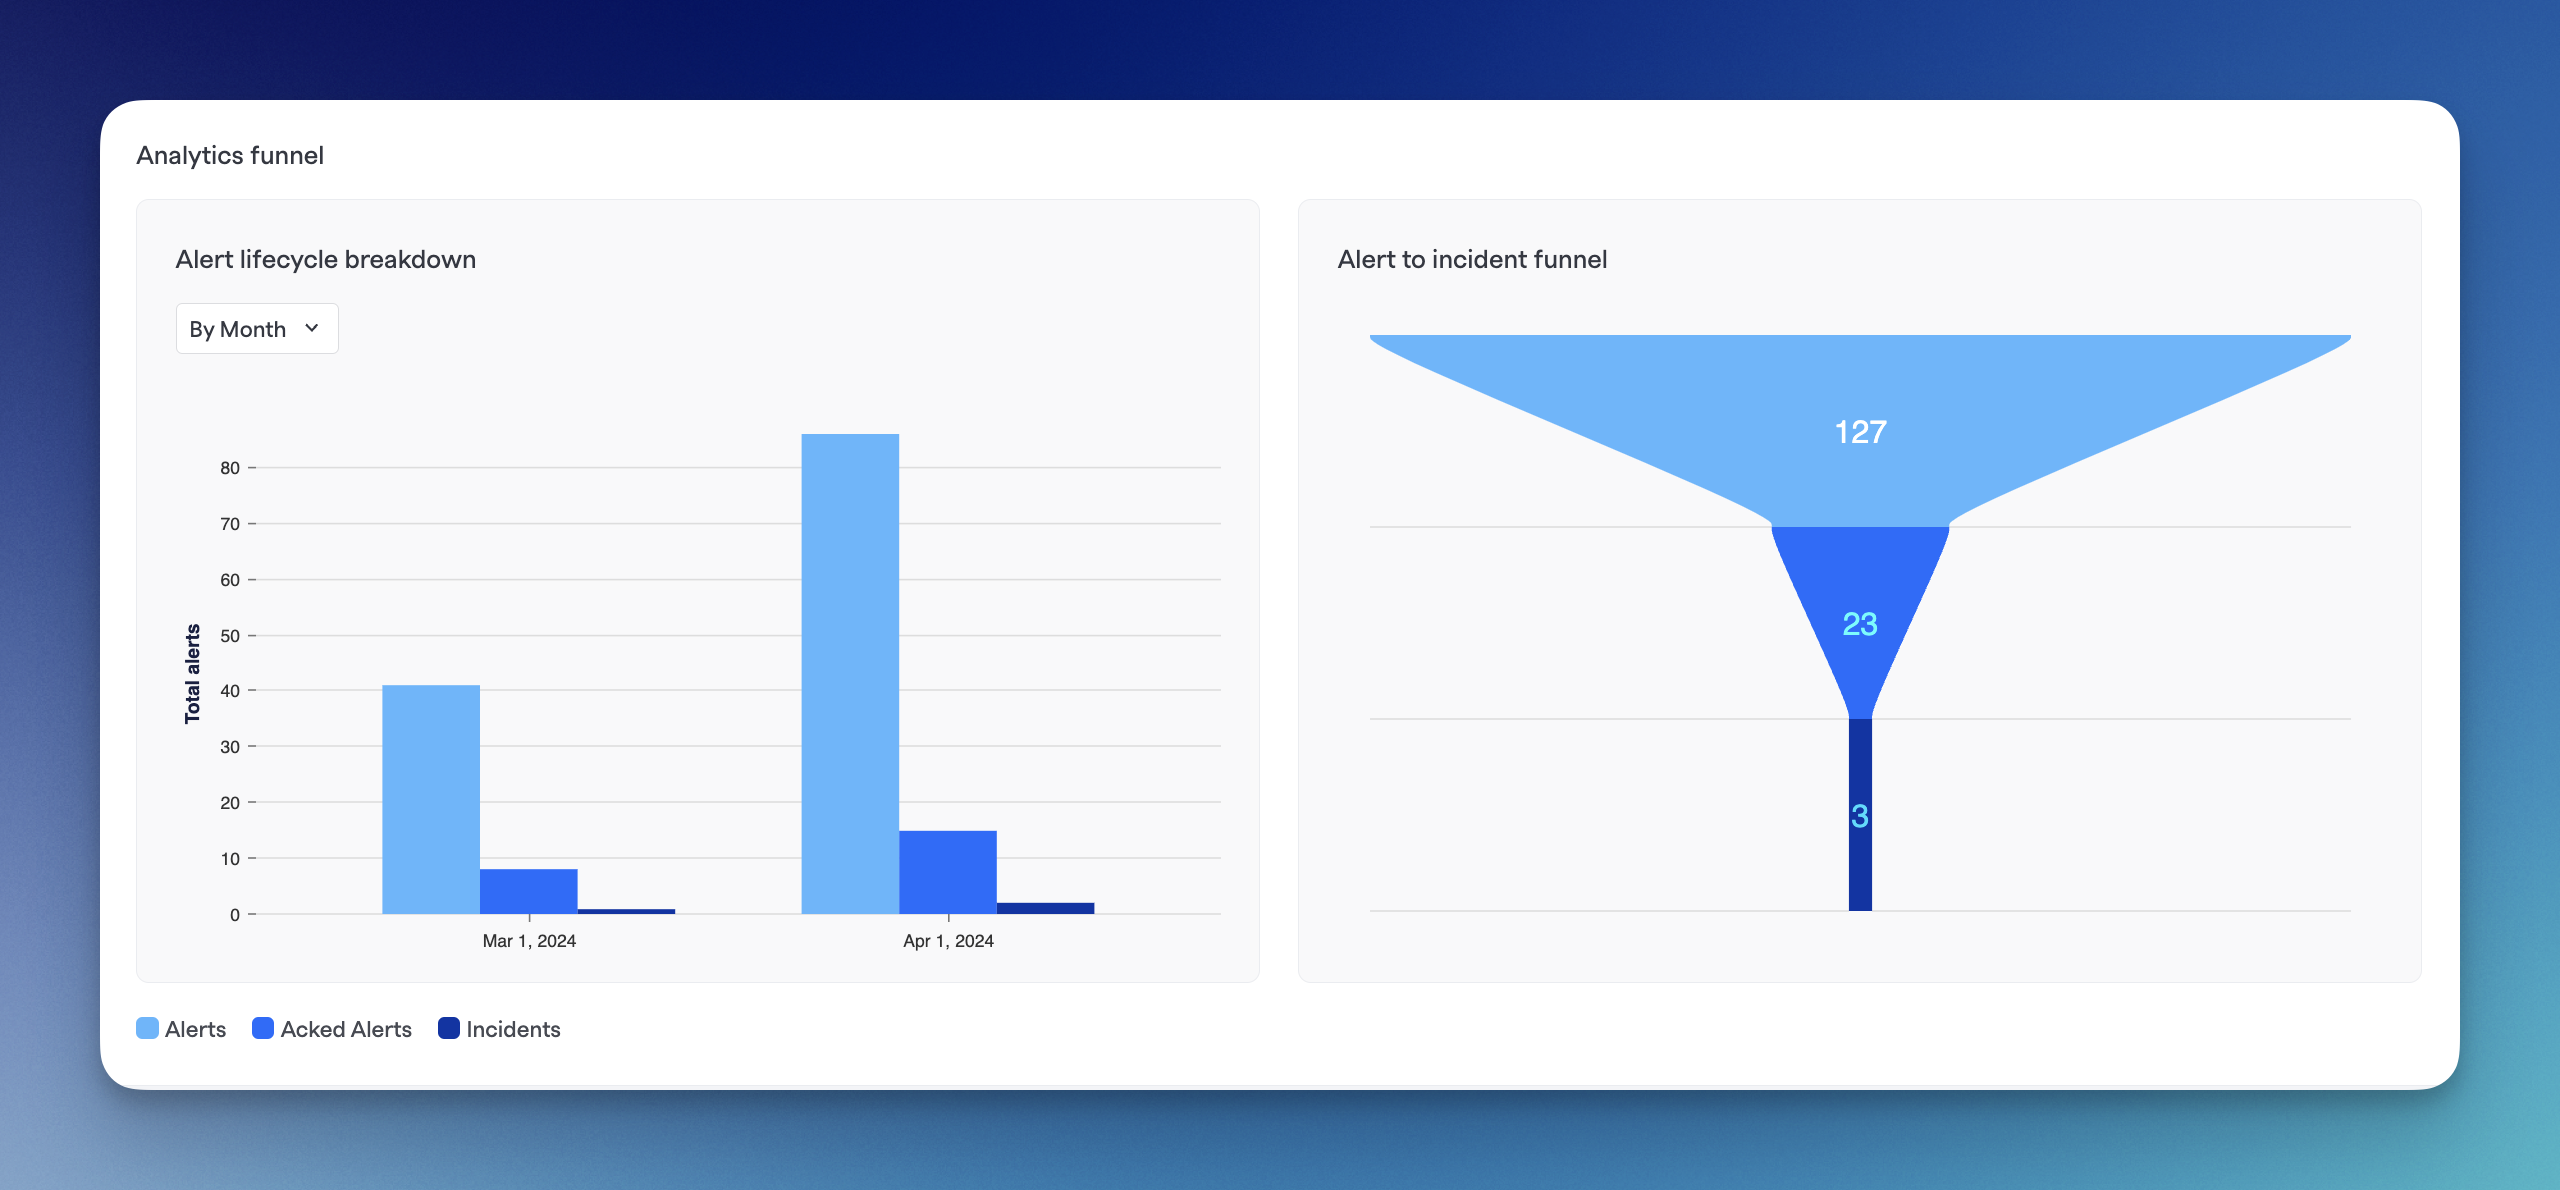
Alerting Funnel
The funnel helps understand the number of Alerts the team receives vs. acknowledges and how many of them actually become incidents.
A funnel with a large mouth and skinny spout suggests that responders are receiving a lot of false alarms that do not turn into incidents. The more cylindrical/uniform the funnel parts are, the healthier the signal-to-noise ratio is.
Time and day heatmap
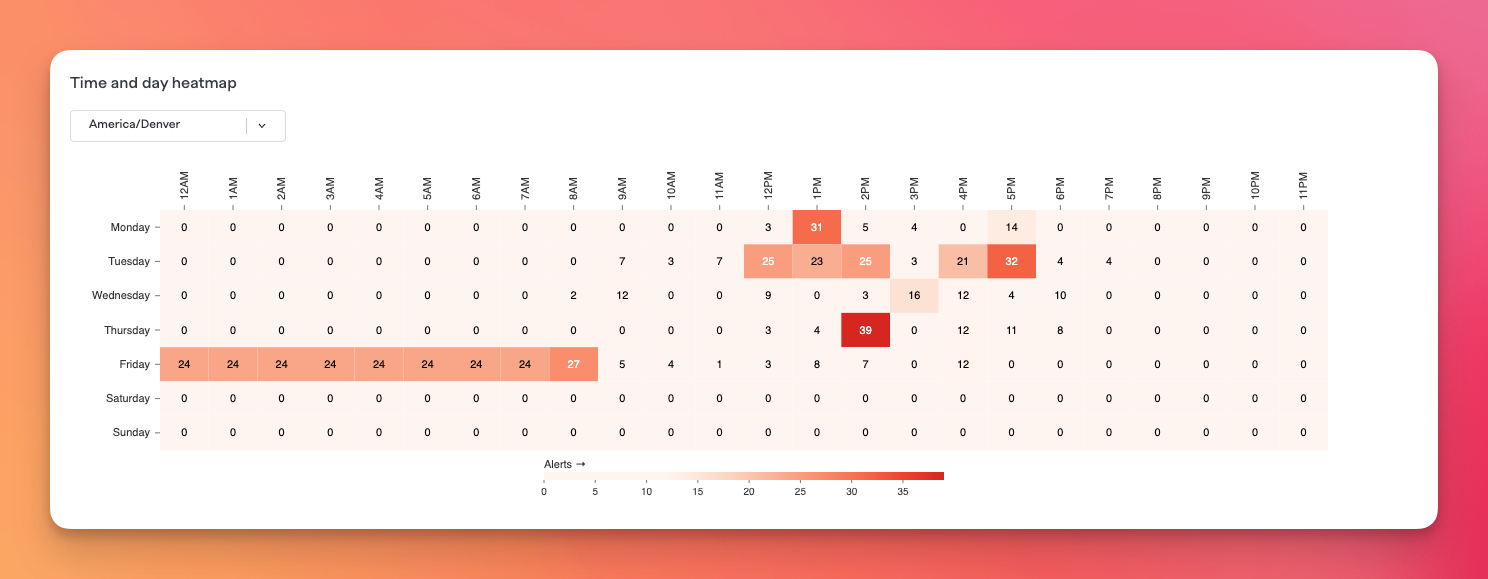
Time and Day Heatmap
The time and day heatmap shows you which days and times of day you are receiving the most alerts.
This can help you determine, e.g., whether it was only a specific, temporary event that led to a cluster of alerts this last month or whether there is a recurring event at a specific time of the week liable to cause problems.
Alerts grouped by entity
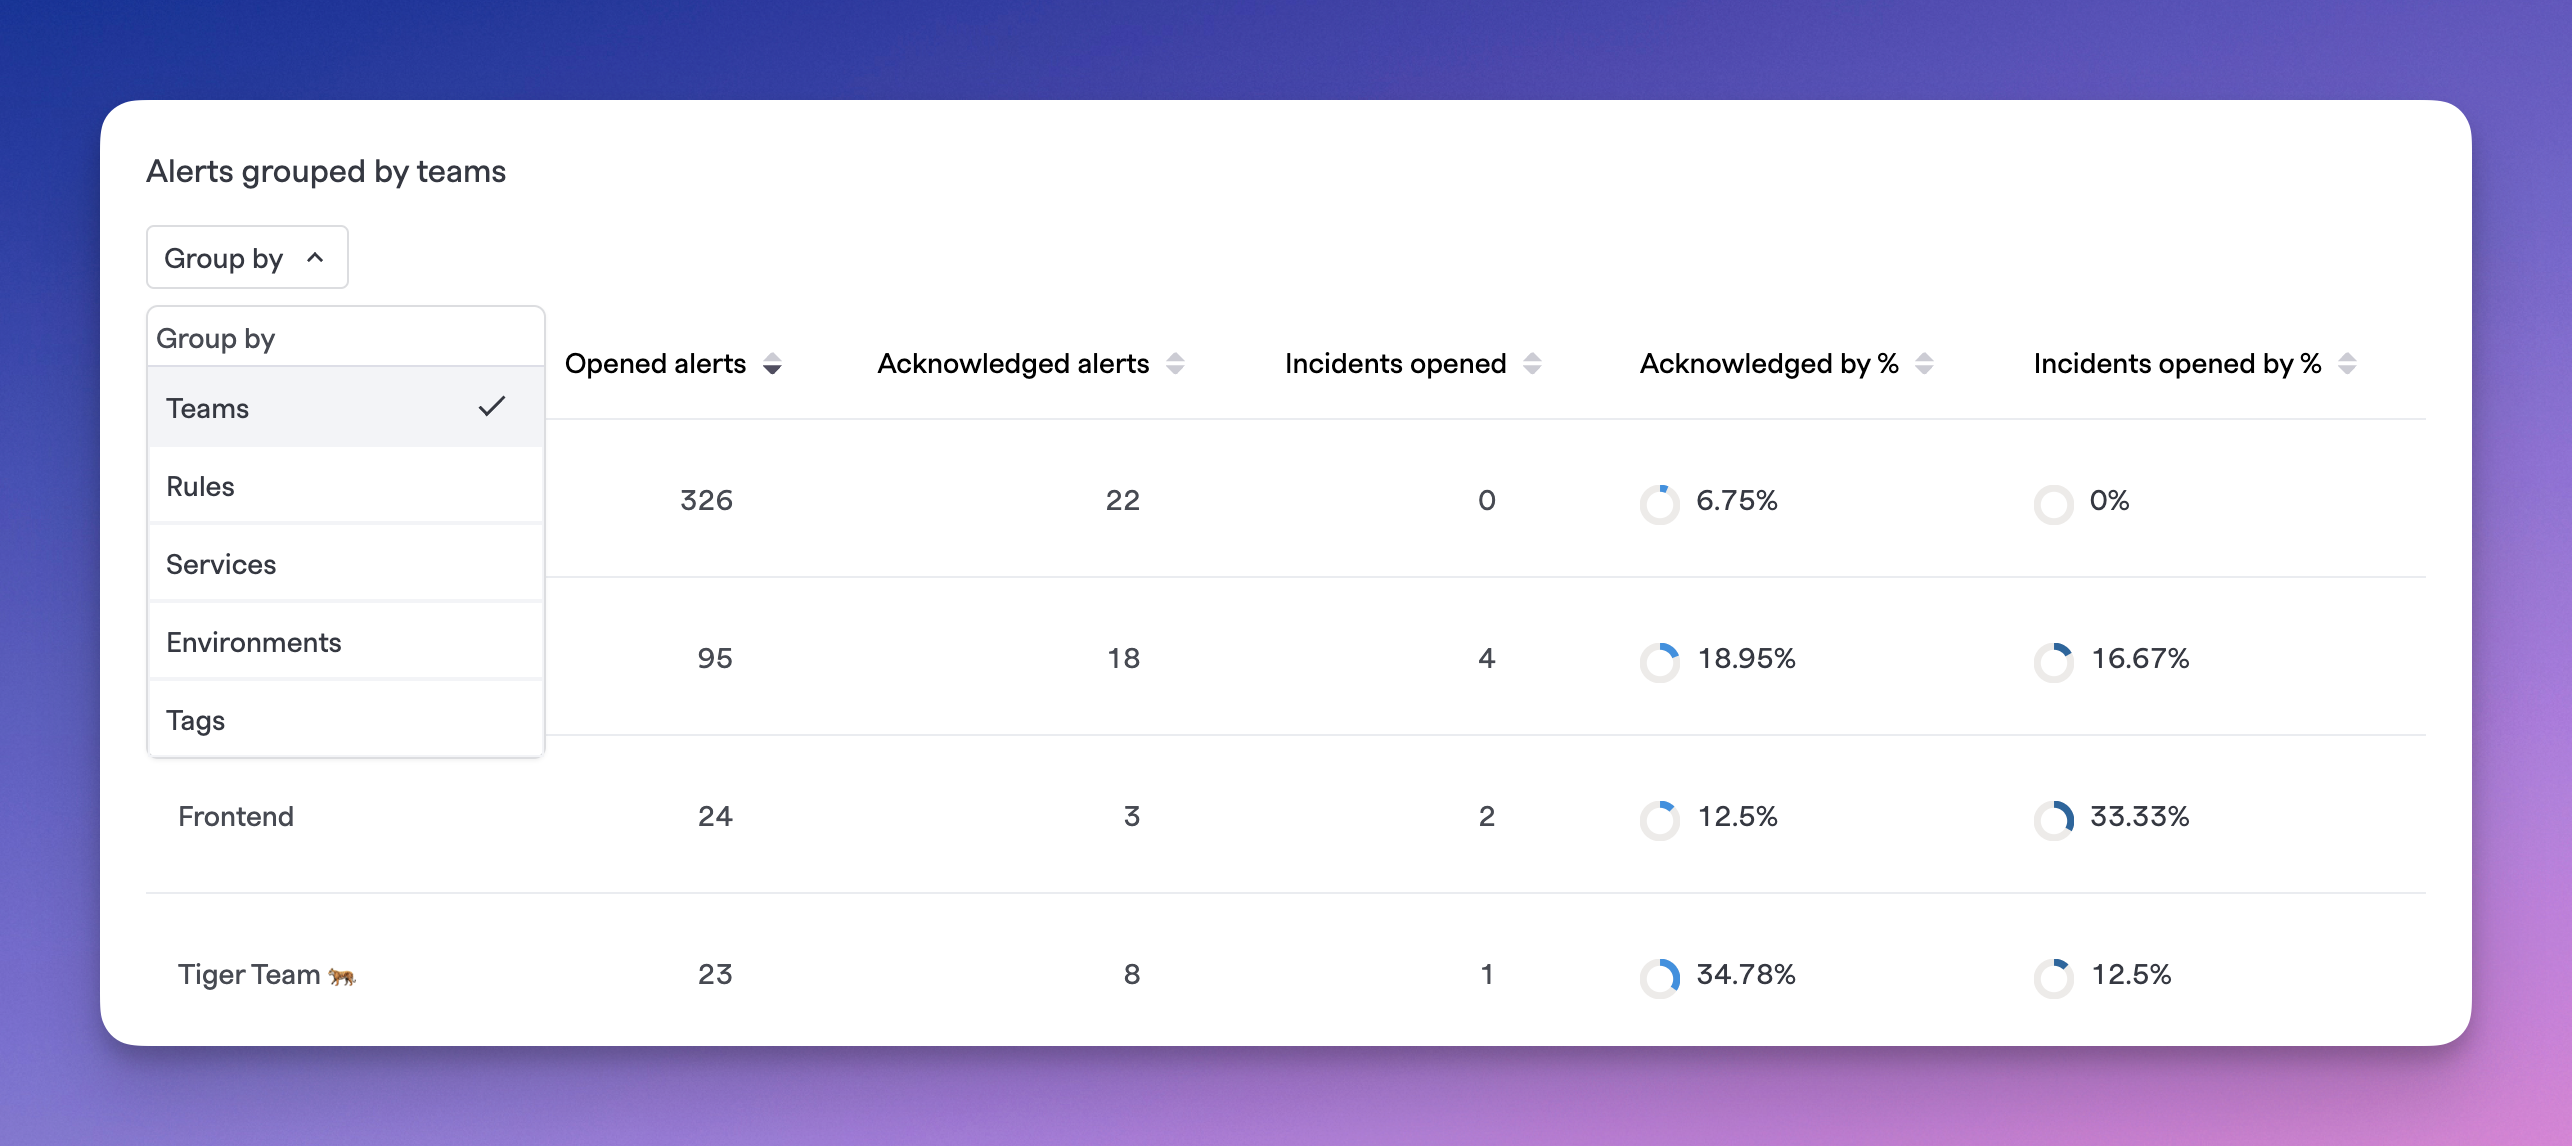
Alerts table grouped by various entities
The final table on the page shows all of the baseline metrics above, but split out according to the grouped entity. The default grouping is set to Teams, but you can change the grouping to see how the baseline stats by Rules, Services, Environments, Tags, and more.
Updated 10 days ago