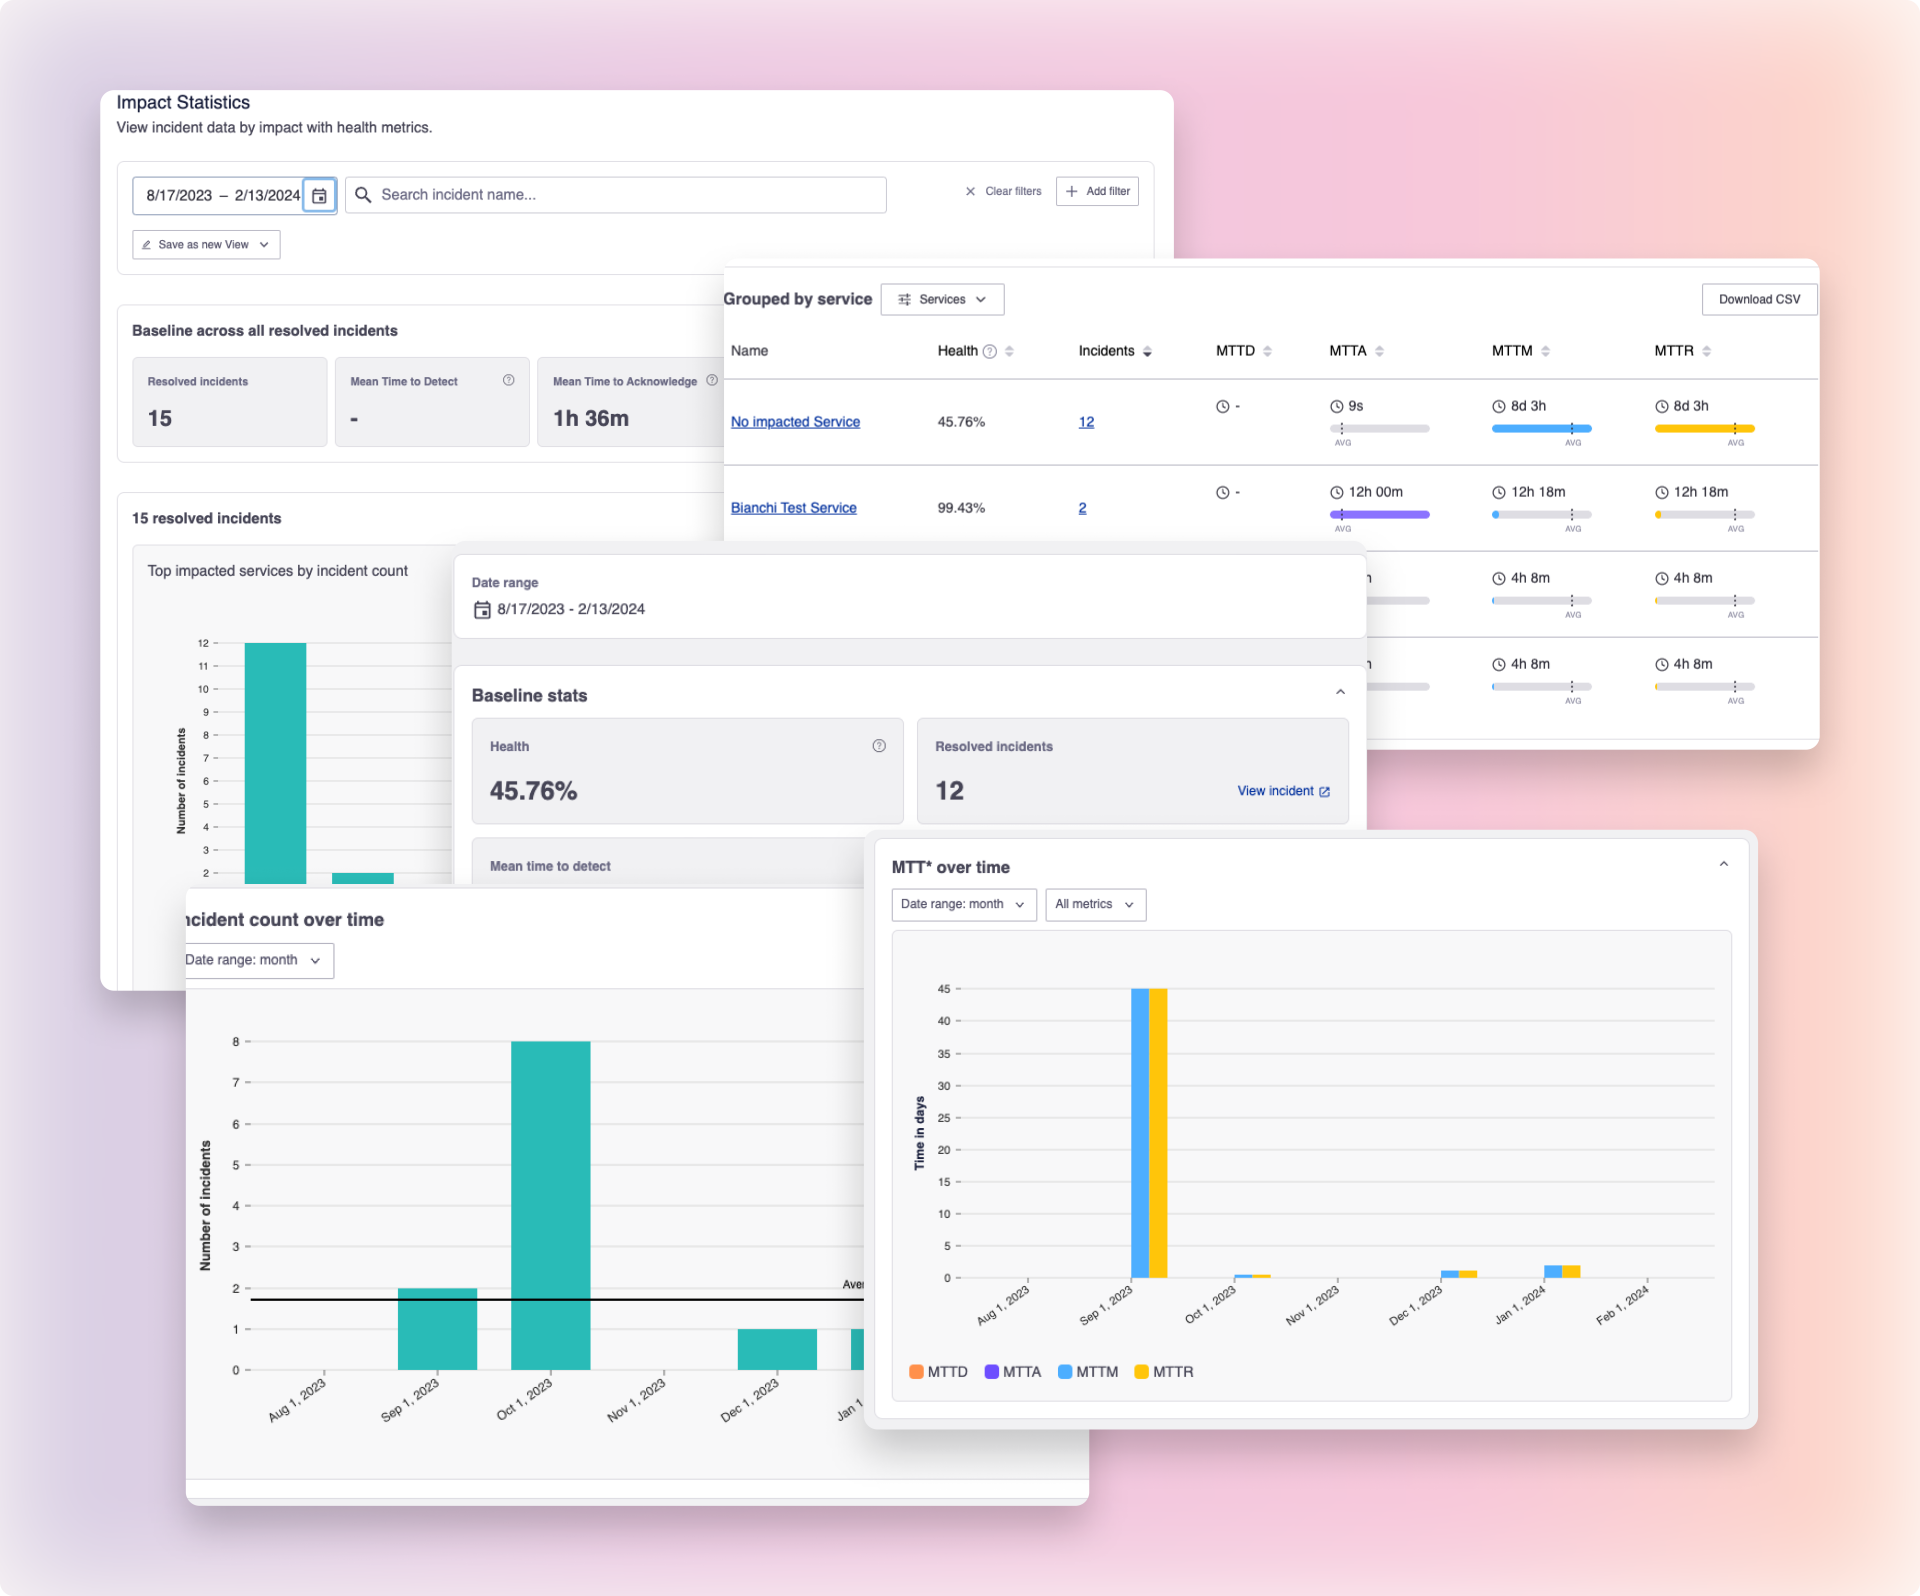
The most difficult part of the incident response process is learning from it, and learning from incidents without having data is like searching for the perfect piece of chocolate in an assortment box: time consuming, with lots of squinting at the little cards that tell you what you’re getting. Today, we’re announcing general availability to our analytics that will make it easier for you to find exactly the data you’re looking for in FireHydrant’s analytical box of chocolate.
MTTX Analytics
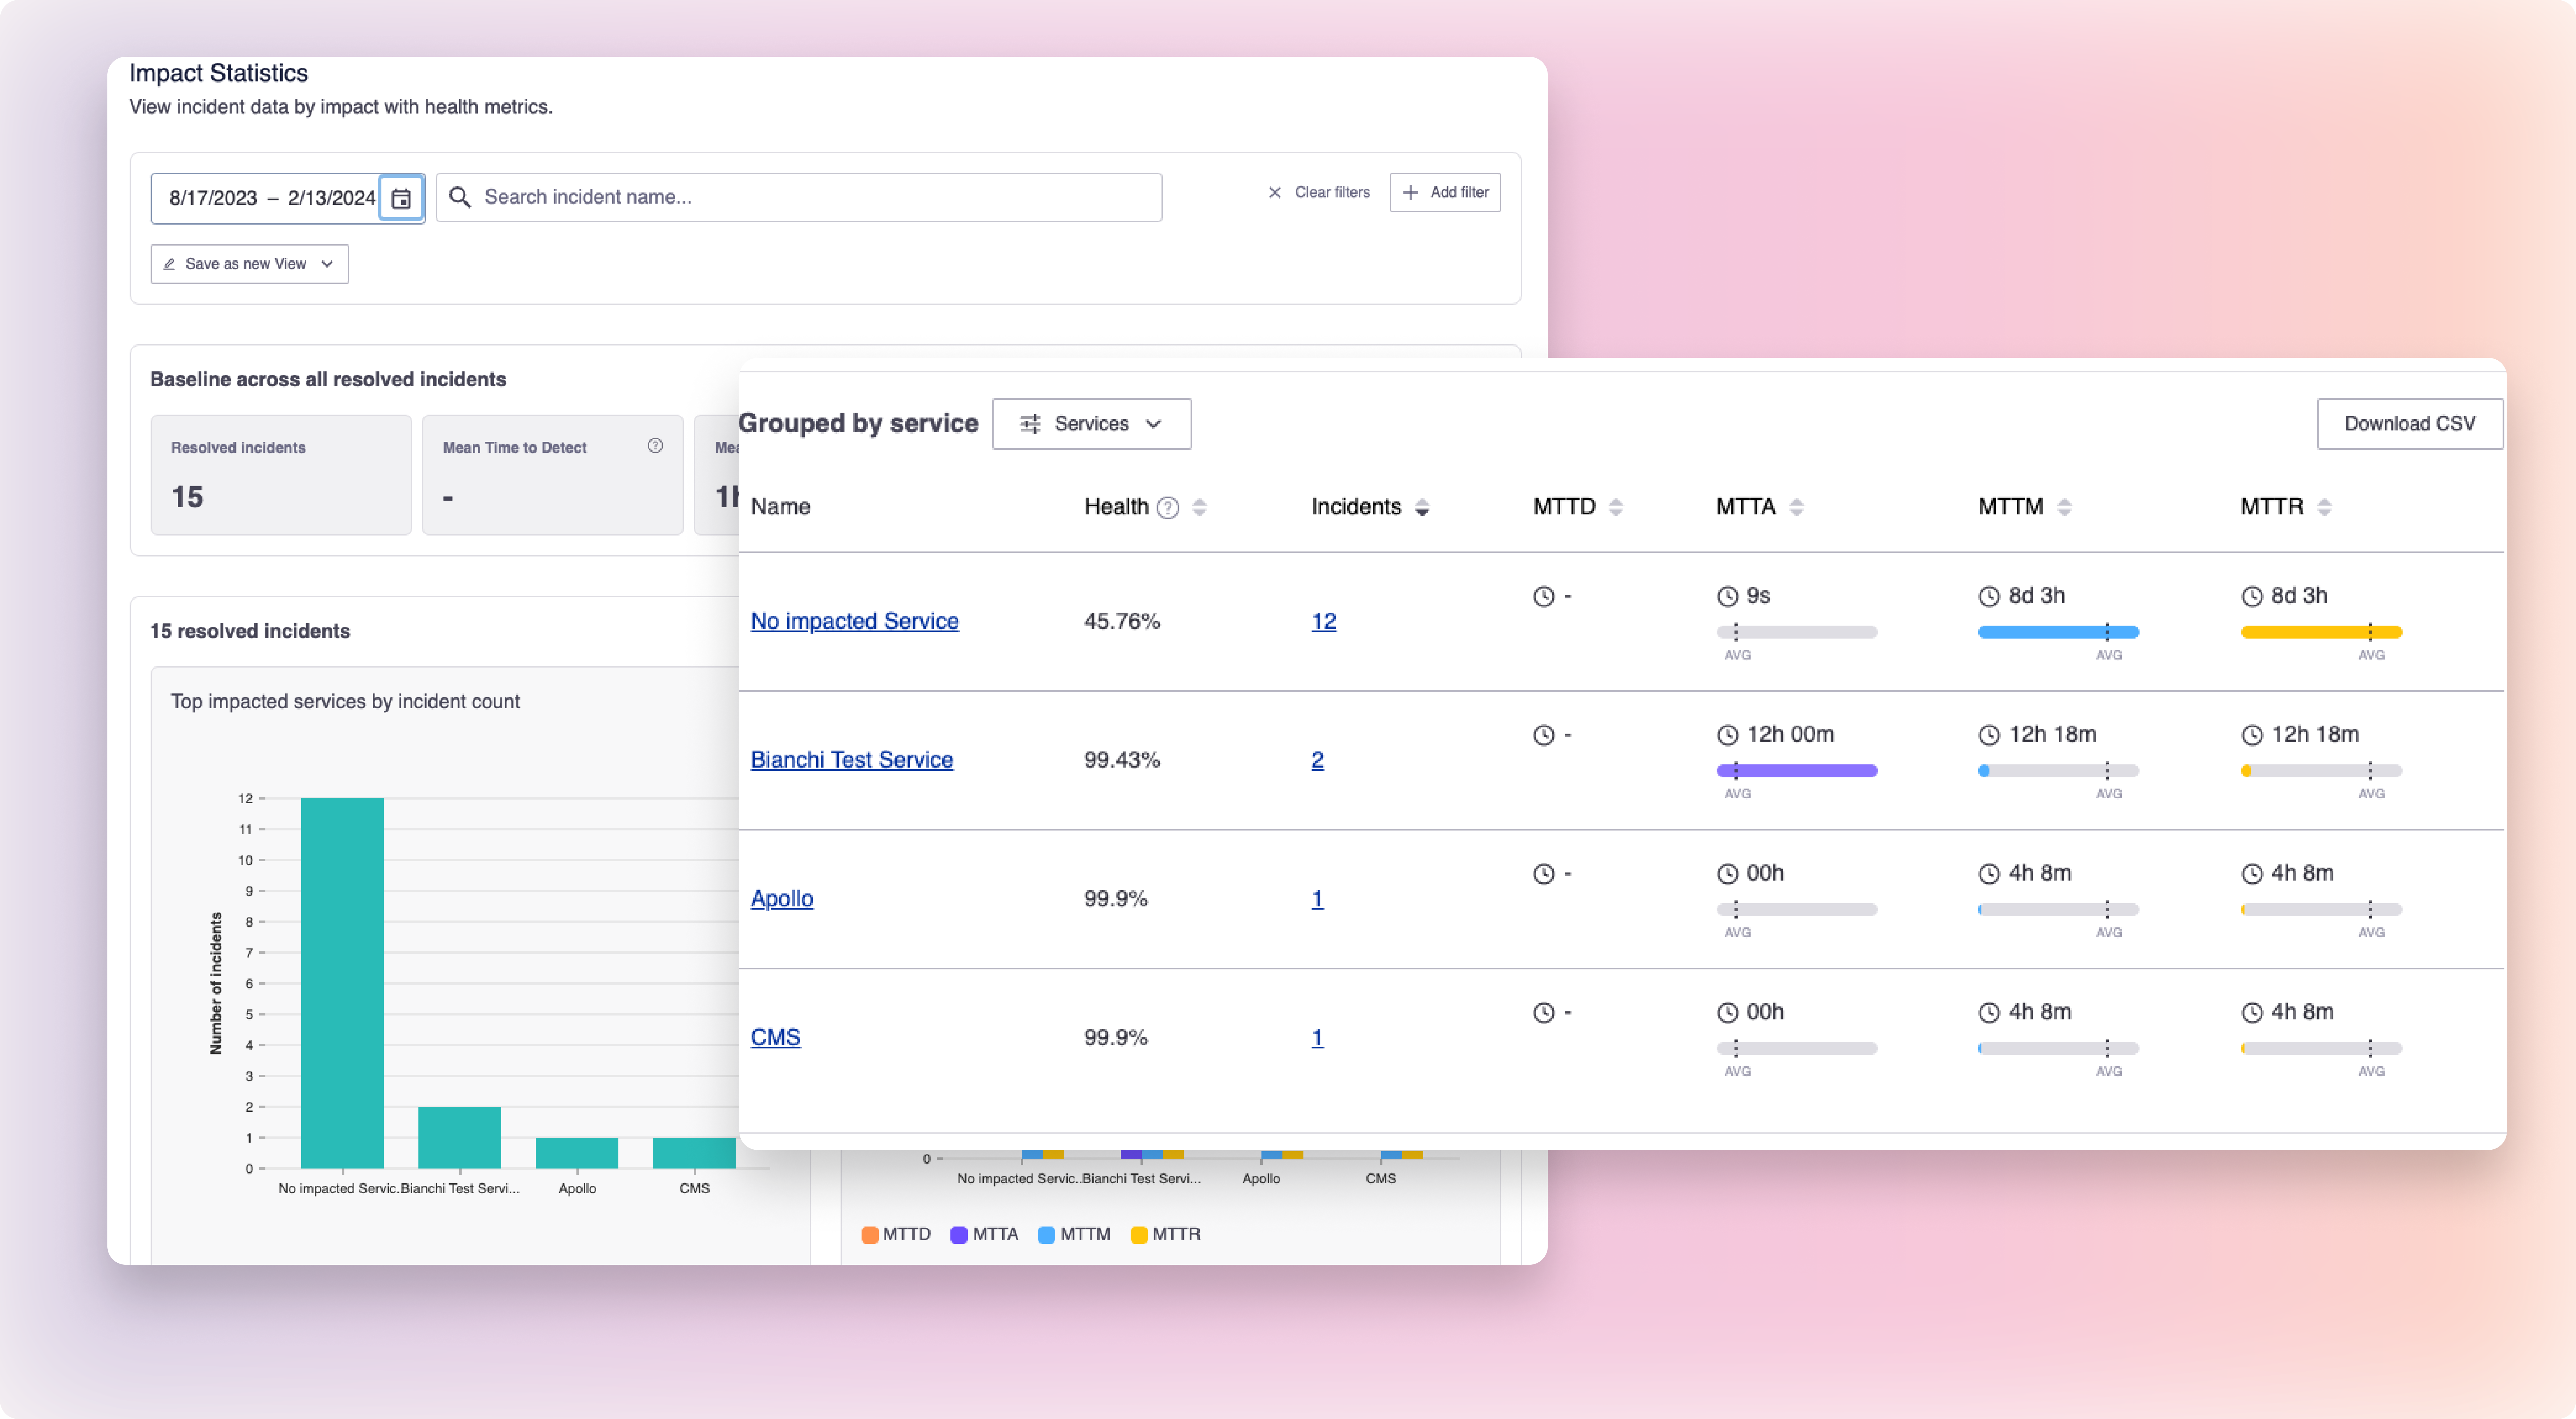 MTTX analytics is designed to help you find your baseline mean-time-to metrics and then break the MTT* metrics across any dimension. This applies across all metadata in FireHydrant: from Services, Environments, and Functionalities to provide incident response context across technology areas; to Users and Teams to help you identify who might be at the most risk of burnout. You’ll also be able to see how each of these compares to your baseline MTTX, and filter it down to see how specific types of incidents impact any of these dimensions in context.
Data Trust and Cleanliness Views
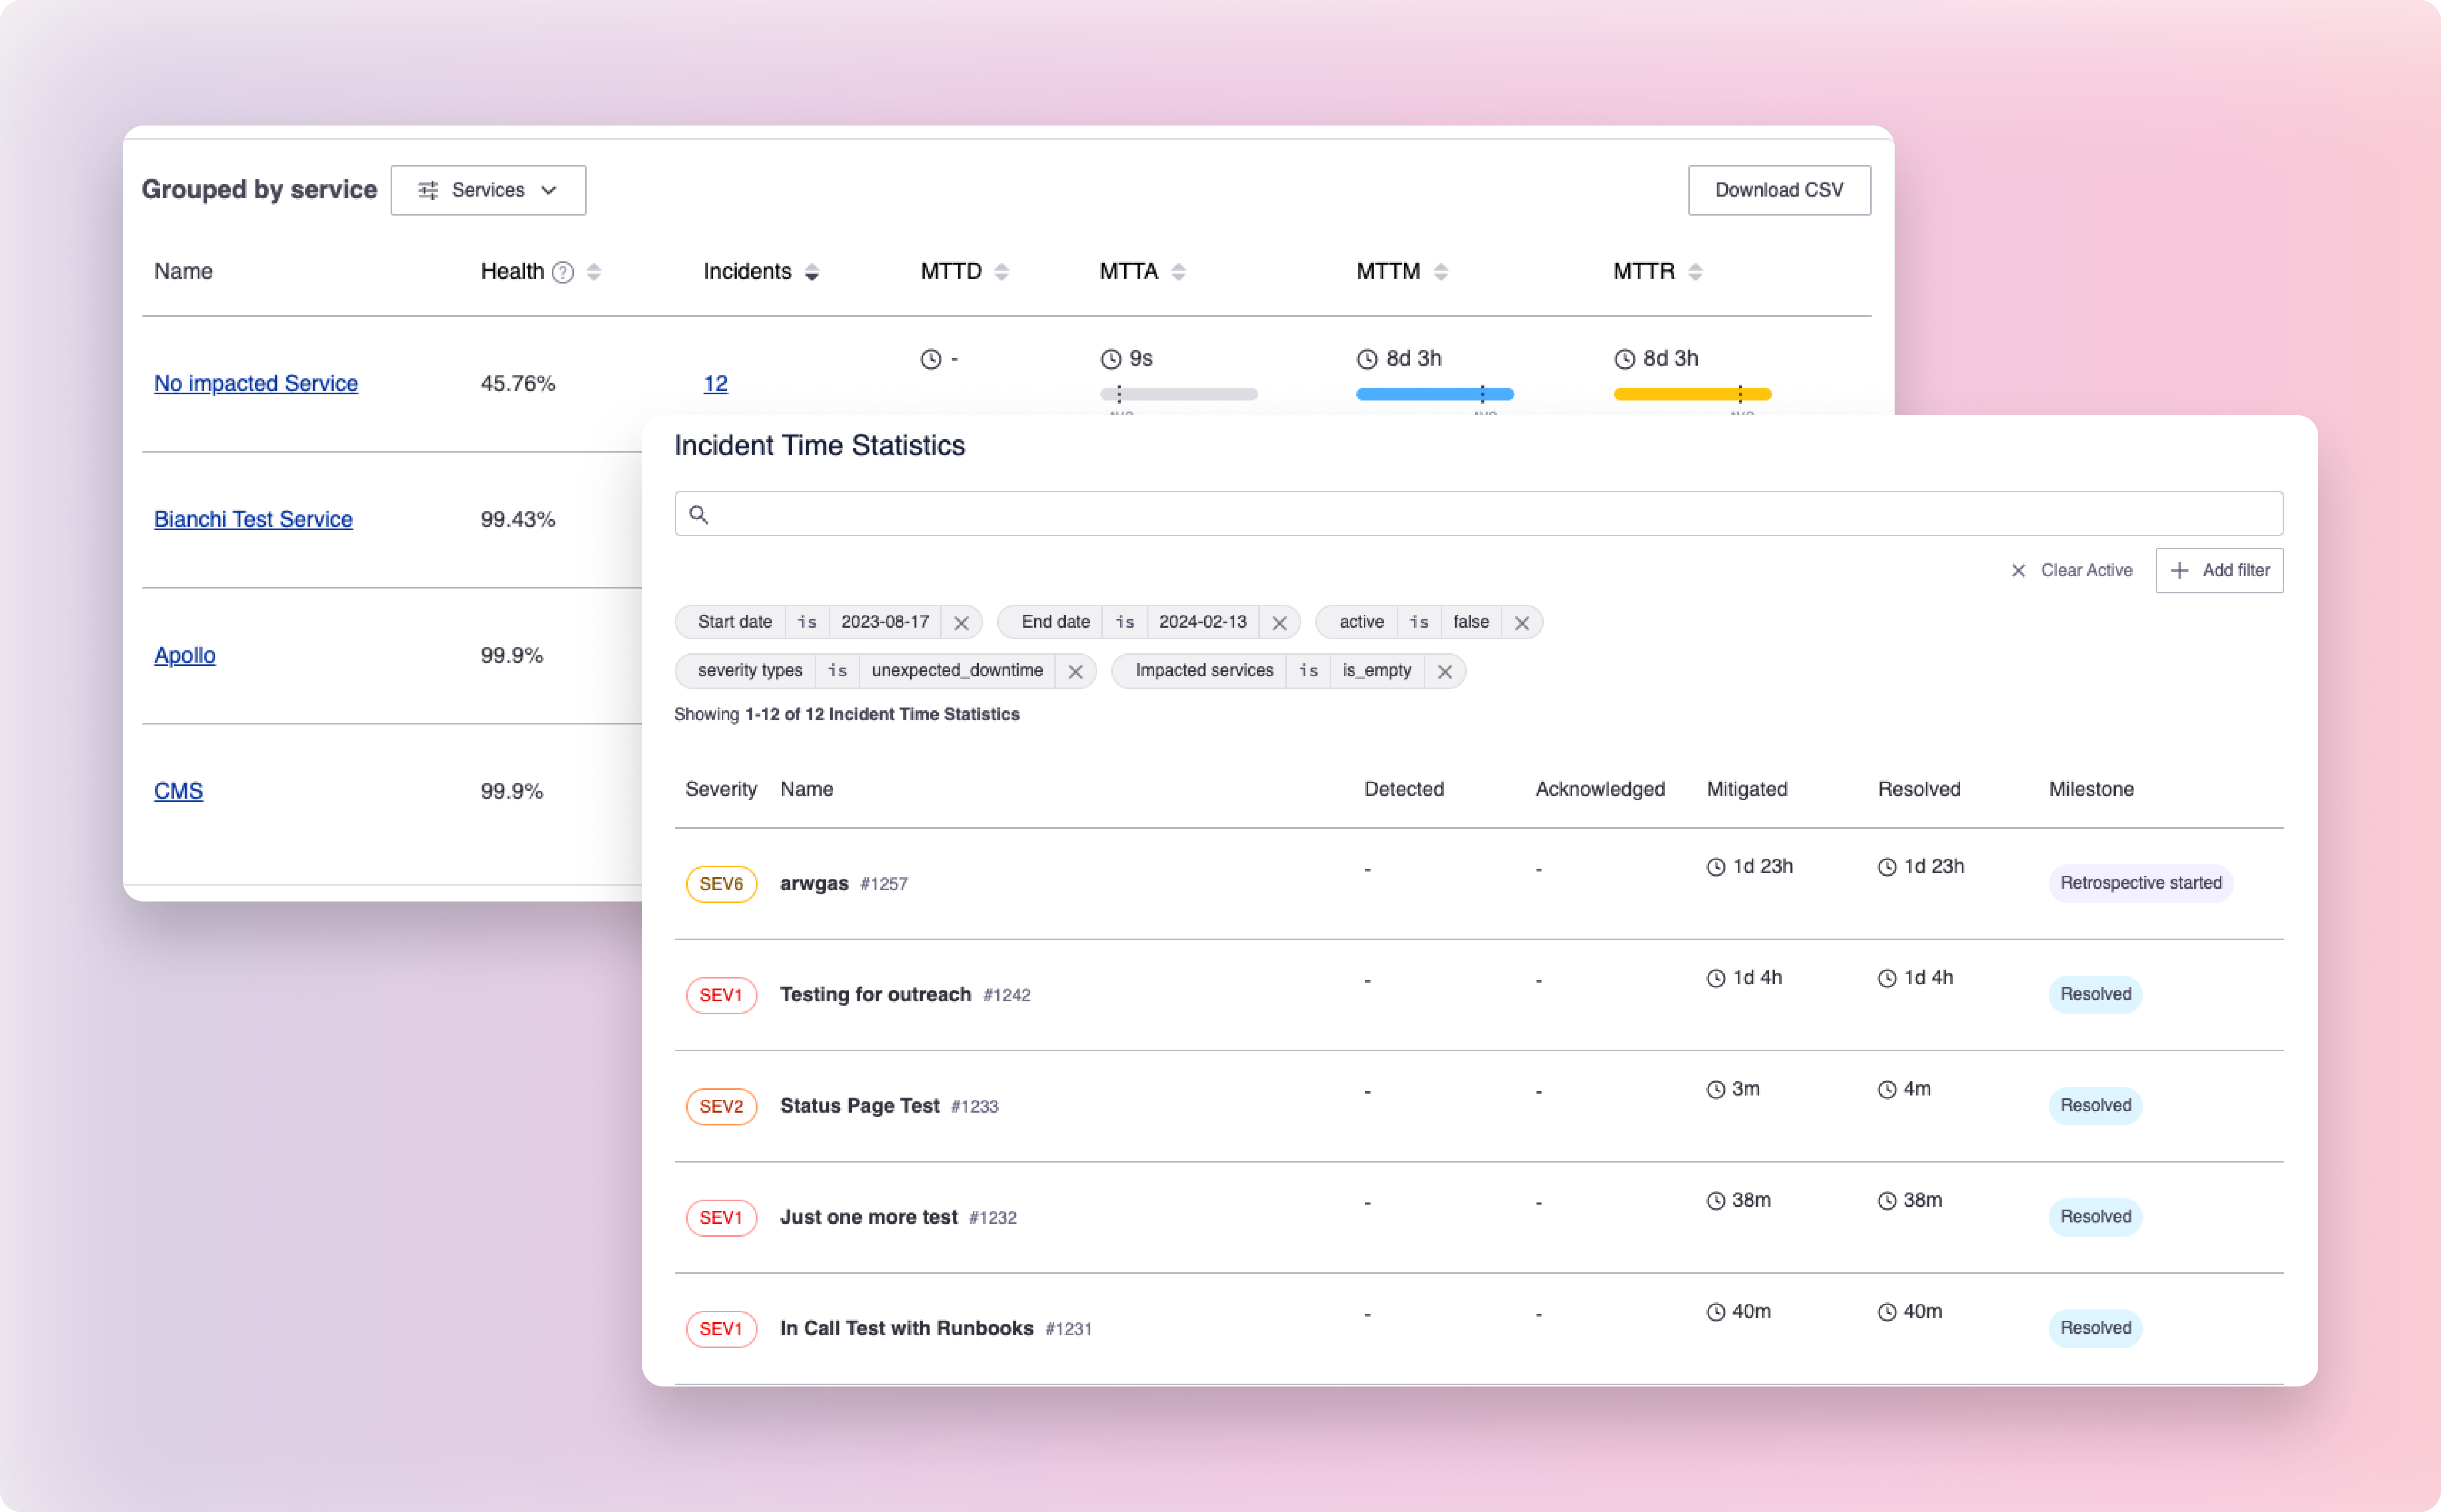 As you look at MTTX analytics, there might be times when the data you see doesn’t match your intuition. We’ve added views in MTTX analytics that will help you validate, and clean the data that we’re using as our inputs to MTTX analytics. By clicking on the number of incidents next to a metric, you’ll not only be able to see the metrics for those specific incidents, you’ll be able to go directly into those incidents, and “clean up,” editing milestone times and metadata. You’ll even be able to identify incidents that did not get correct metadata, looking at incidents grouped under No Impacted Functionality/Service/Environment/… really any metadata that you might care to pull in. Any updates to metadata will update in real time, allowing you to see the impacts of your changes immediately.
MTTX Over Time
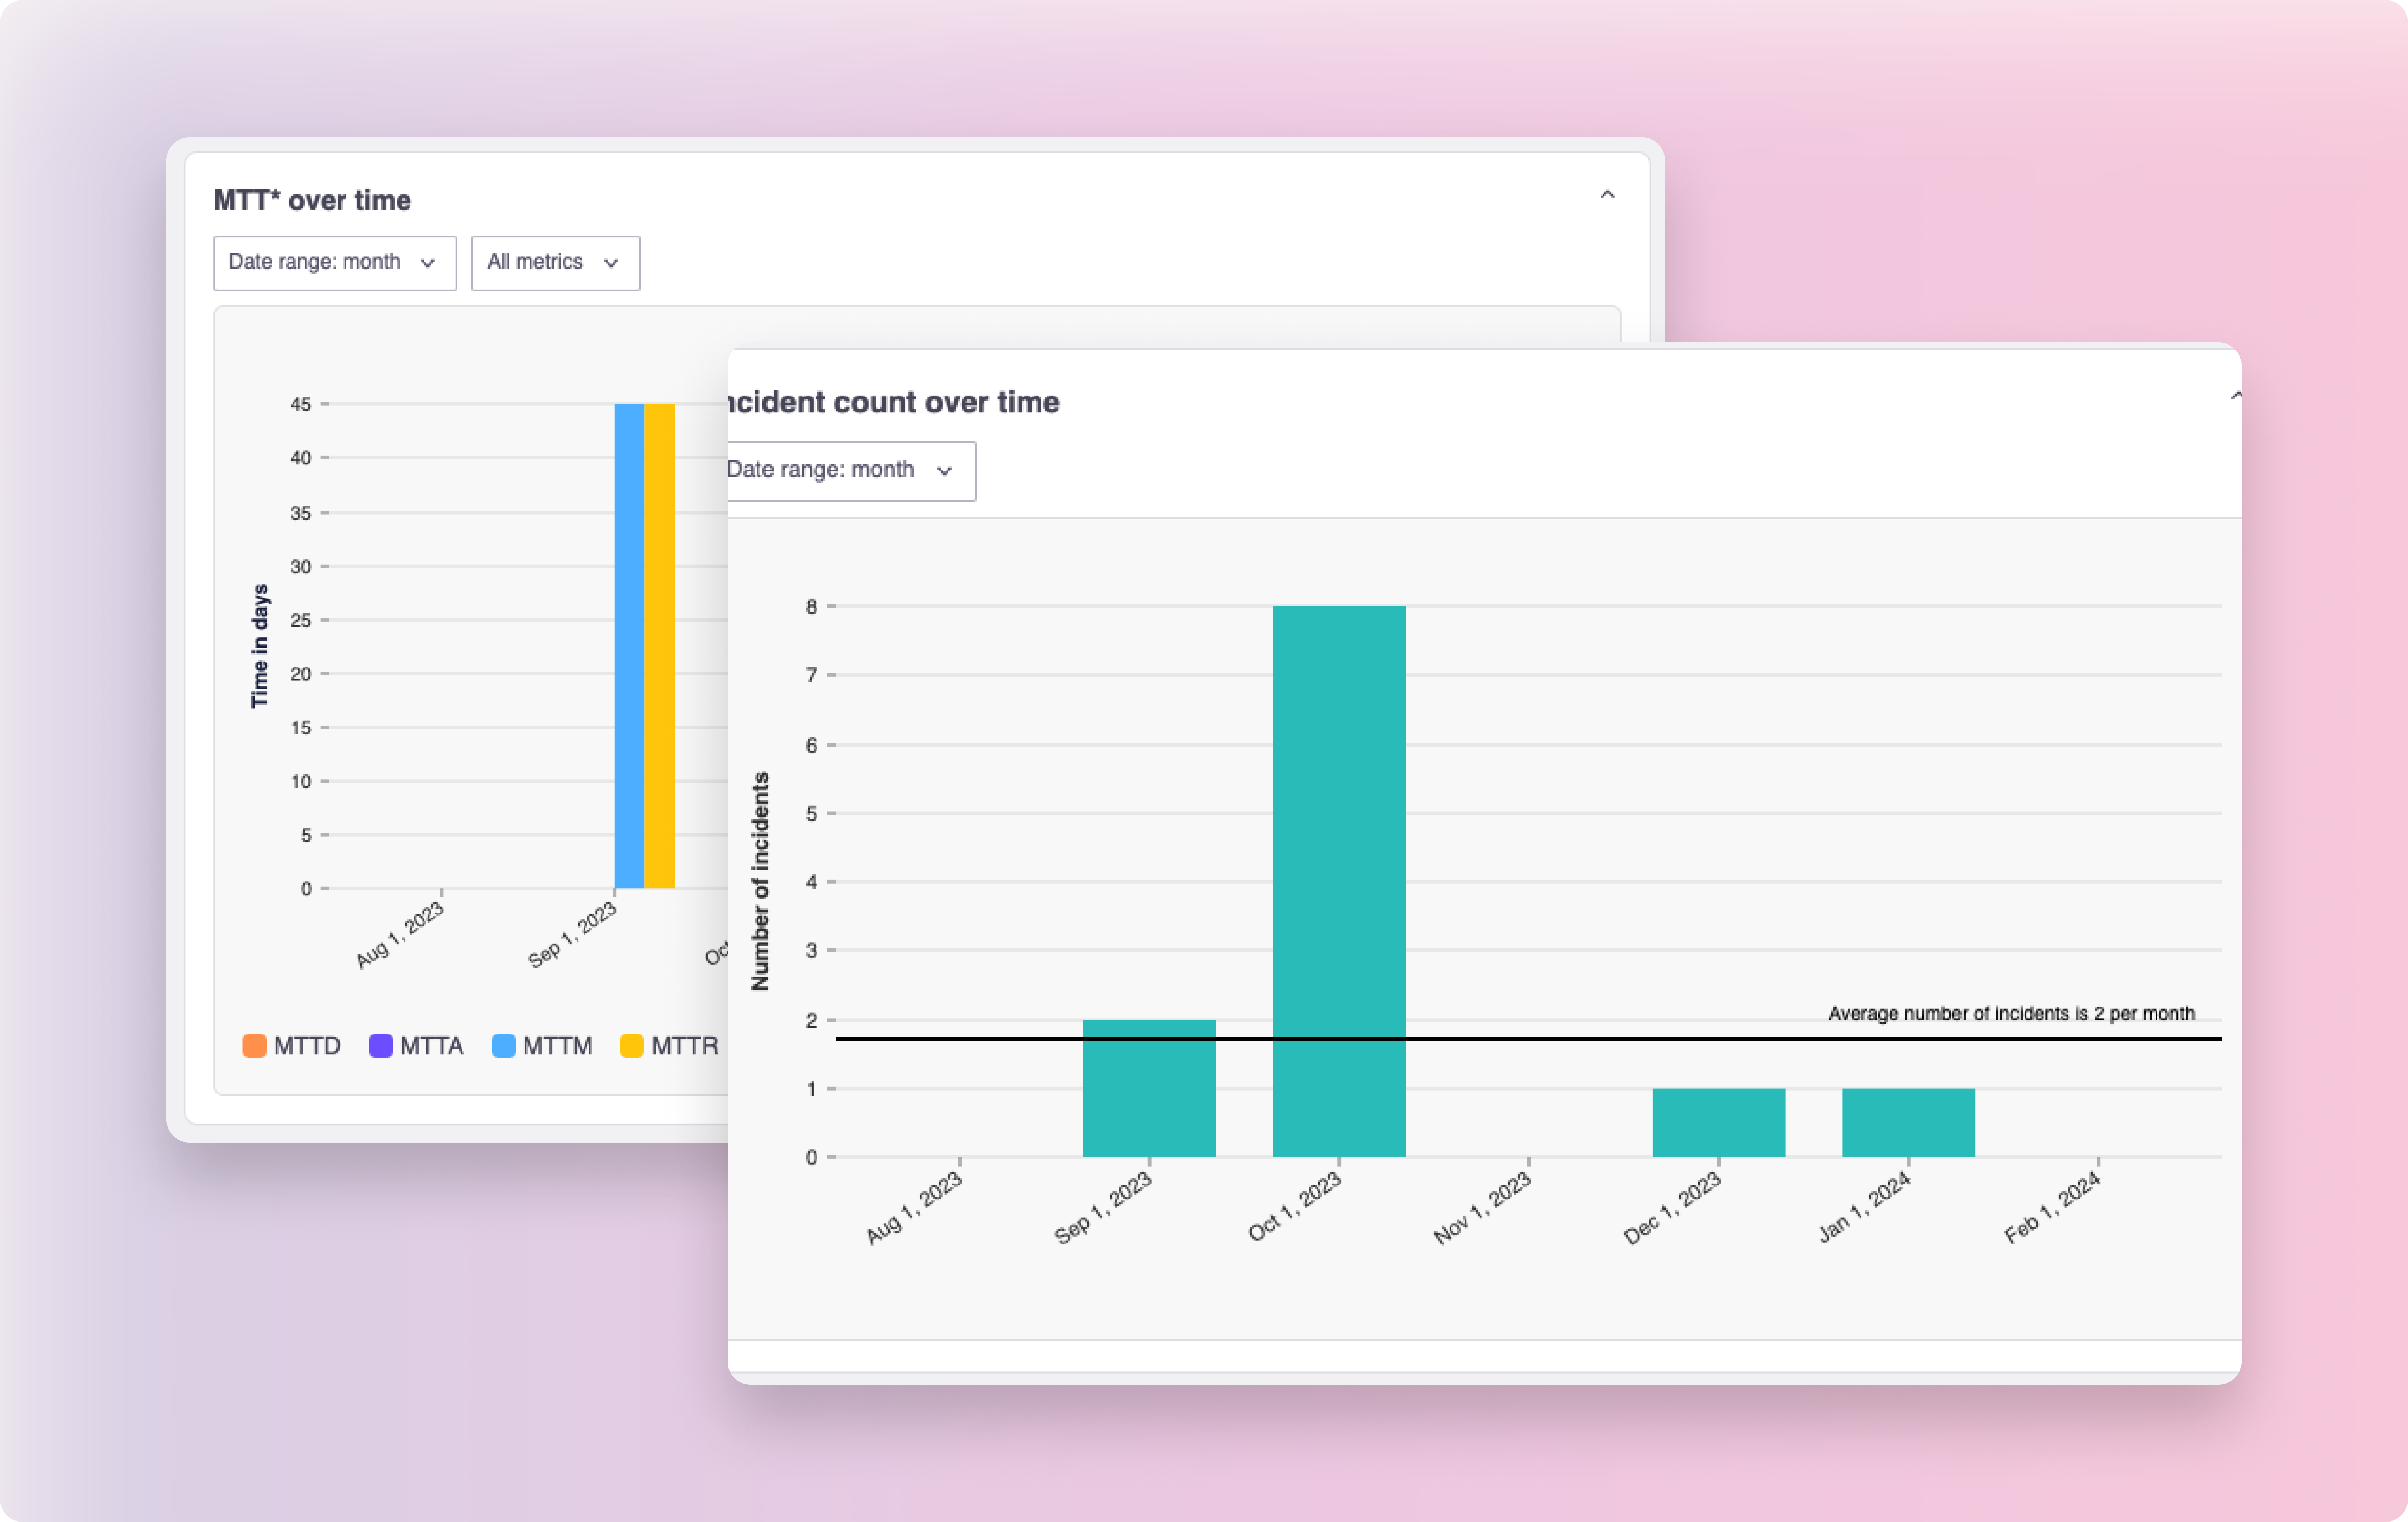 After getting context on different dimensions as compared to the baseline, you’ll probably be asking the question of “has it always been this way?” Fortunately, we have the answer! By clicking on any grouping, you’ll be brought to a drawer that will show you not only Analytics for that particular grouping, but how those analytics have changed over time, and if there’s any need to be concerned. Find the service that has been progressively less reliable over time today, use it to make the case for proactive improvement.
We’re in love with these new improvements to analytics, and we hope they help you find the perfect piece of chocolate (data) in the deep box that is incident response data. To find the new analytics, navigate to MTTX Analytics, by clicking the Analytics button in the top nav of app.firehydrant.io and dive in. Happy Firefighting!
See FireHydrant in action
See how service catalog, incident management, and incident communications come together in a live demo.
Get a demo