Signals Is Lighting Up the Future of On-Call: Eight (Yes, 8!) New Features Just Released
We’re going beyond notifications — and building the most powerful, flexible, and team-first on-call experience on the market.
When we launched Signals, it was because alerting and on-call desperately needed a reset. Legacy tools hadn’t evolved with the way modern teams work — they were individual-centric, inflexible, and wildly overpriced. Signals changed that.
But we’re not stopping at “better alerts.” We’re going beyond alert delivery and aligning on-call functionality to how teams actually run their incident response — with teams at the center, data driving decisions, and every detail built for the engineer on the front lines.
Today, we’re releasing eight new features that make Signals even more powerful, flexible, and collaborative — and (yes) more enjoyable to use.
🔥 Want to see it all in action? Join the live webinar, The Burn Down, on July 9th where I will demo all the new features.
Why? Because incidents aren’t solo missions.#why-because-incidents-arent-solo-missions
You’re not firefighting alone anymore. Your team swaps shifts, owns services, collaborates in real-time, and expects tools that reflect that reality. These new features give you shared visibility, smarter notifications, fewer gaps, and more control over how, where, and when alerts get delivered.
🚀 What’s New in Signals#whats-new-in-signals
- Team Analytics Revamped: A complete view of your team’s on-call performance: alerts, incidents, MTTA/MTTR, and alert noise ratios — all available from your Team page and Service Catalog.
- Handoff Summary: Automatically sends the incoming engineer a summary in Slack of the previous shift — including alert + incident counts and direct links to dashboards — so they start with full context, not guesswork.
- Coverage Gap Notifications: Daily Slack + email alerts sent at 9am (set to the schedule’s configured timezone) with a heads-up on unstaffed on-call gaps.
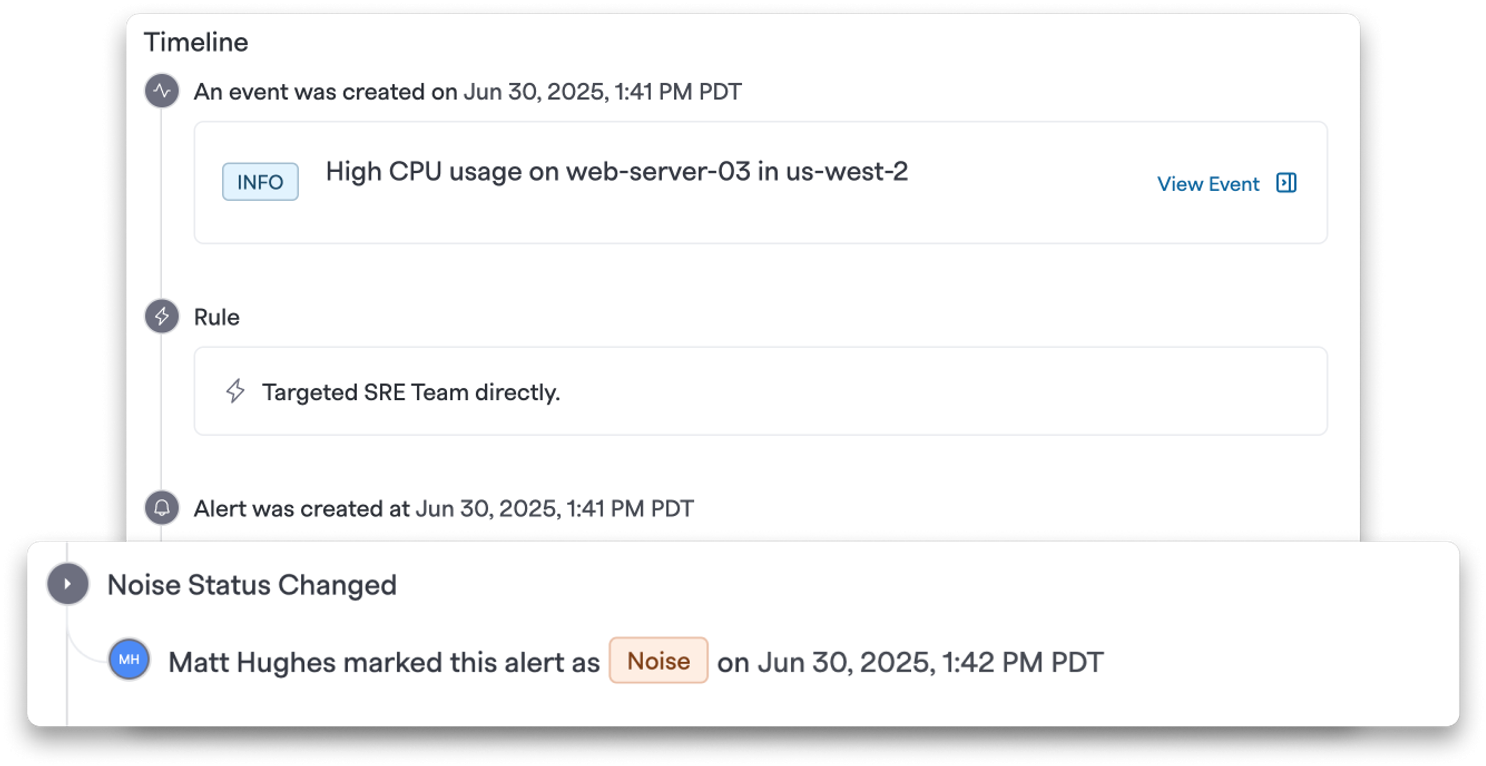
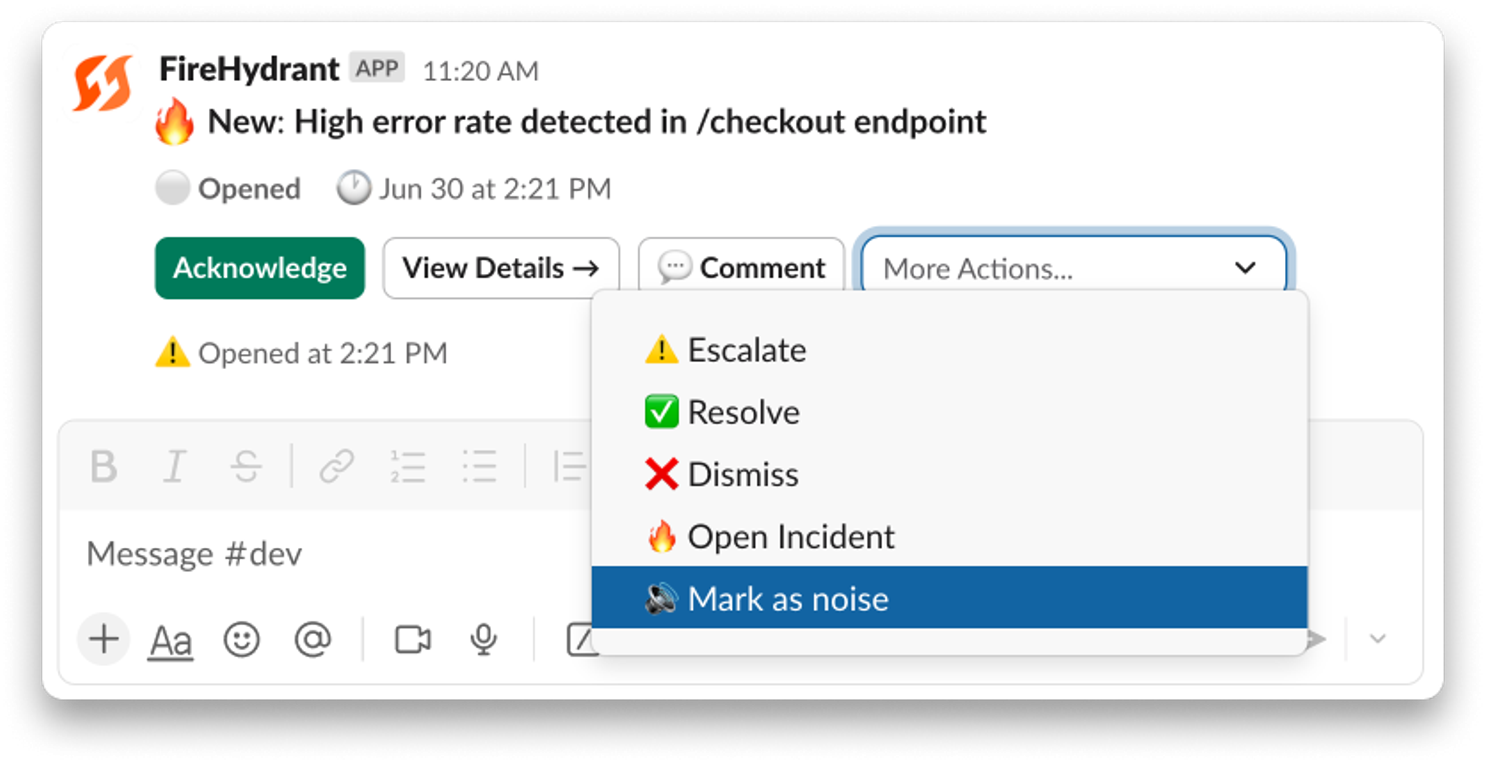
- Alert Noise: Mark alerts as noise in Slack or the UI, filter them in the Alerts view, and see “noise over time” trends in Analytics — complete with timeline context and attribution.
- Alert Visualization: Drop in a sample payload and see exactly how an alert will flow through your escalation policy — who gets notified, when, and how.
- Signal Event Debugging: Full event log visibility for every event submitted to a custom transposer — even those that fail — so you can debug webhook payloads, transposer mismatches, and other alerting hiccups fast.
- Notification Preferences Policy: Define different policies for high, medium, and low priority alerts — including preferred notification destinations and delay settings — with compliance visibility for both admins and users.
- Signals for Microsoft Teams: Set Microsoft Teams channels or direct messages as notification targets in your escalation policies, so alerts go where your team collaborates.
This isn’t just about alerting. This is about building the system your team actually wants to use when things go sideways. Together, these releases raise the bar for what an on-call tool should be.
And we’re just getting started. Watch out for more major announcements in the weeks to come.
Full Feature Breakdown#full-feature-breakdown
📊 Team Analytics Revamped#team-analytics-revamped
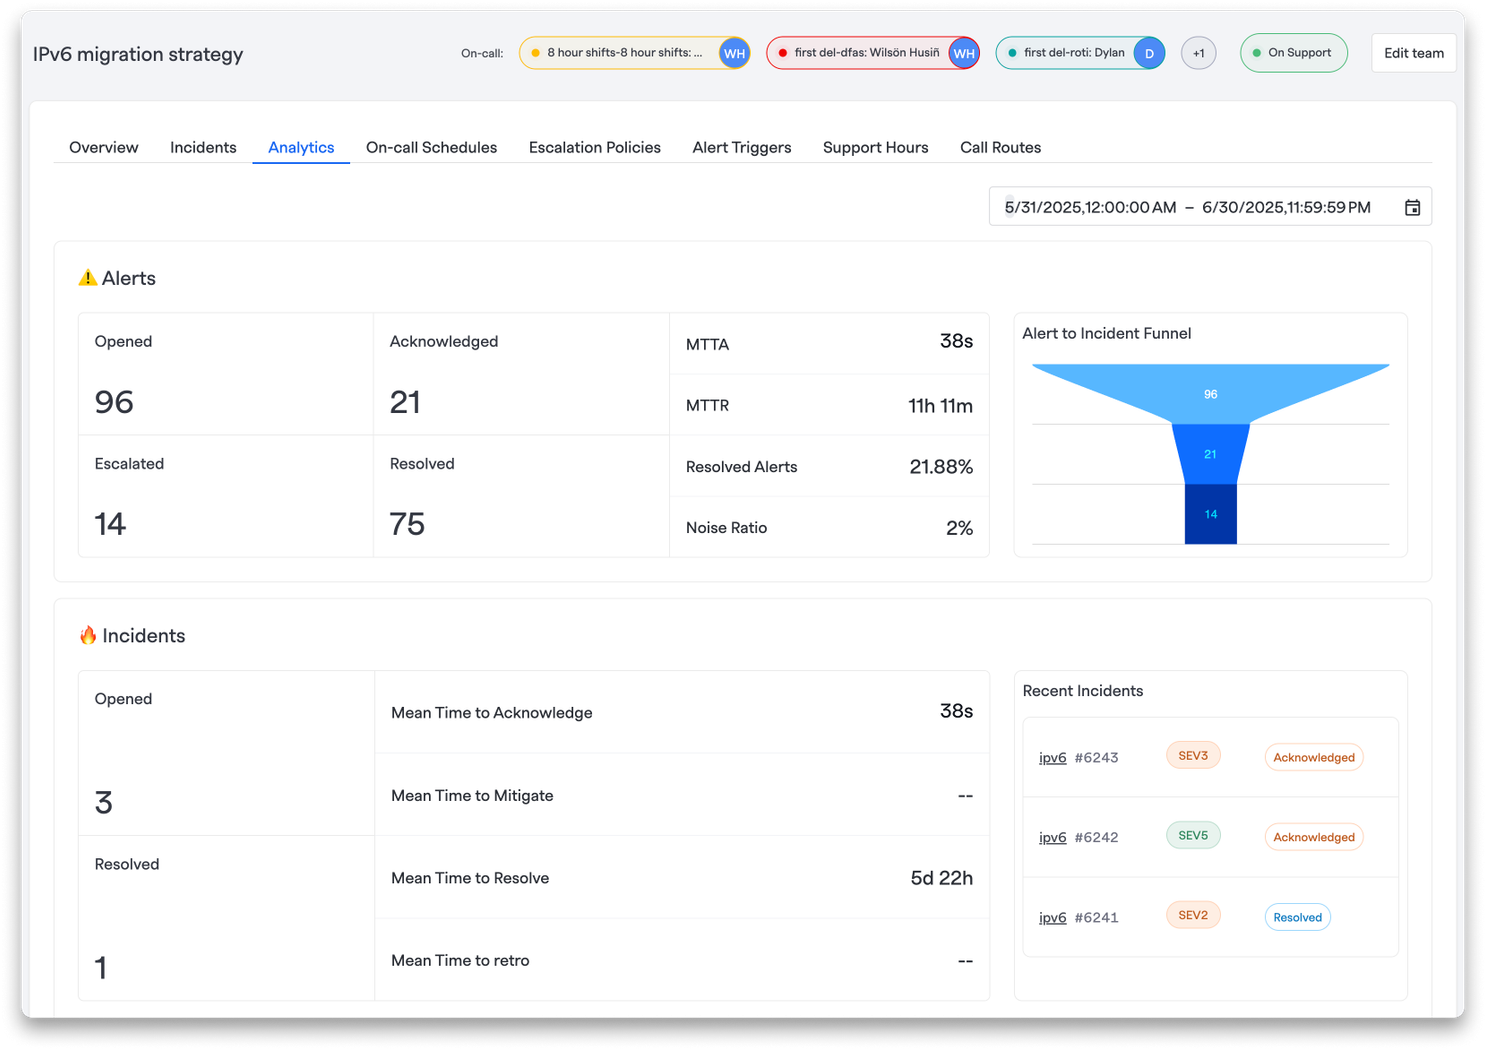
Your Team Analytics page now gives you a single place to see everything that happened during a shift — both alerts and incidents — in a clean, visual summary.
You’ll see:
- Alerts opened, acknowledged, escalated, and resolved, with metrics like MTTA, MTTR, and a new noise ratio to track unnecessary pages
- Incidents opened and resolved, as well as your configured incident milestone measurements like MTTA, MTTM, MTTR, and MTTRetro
All of this data rolls up into a clear, accessible view right on the Team page (as well as the Analytics tab within your Service catalog across Services, Functionalities, and Environments) — making it easy to review, reflect, and improve your response over time.
🤝 Handoff Summary#handoff-summary
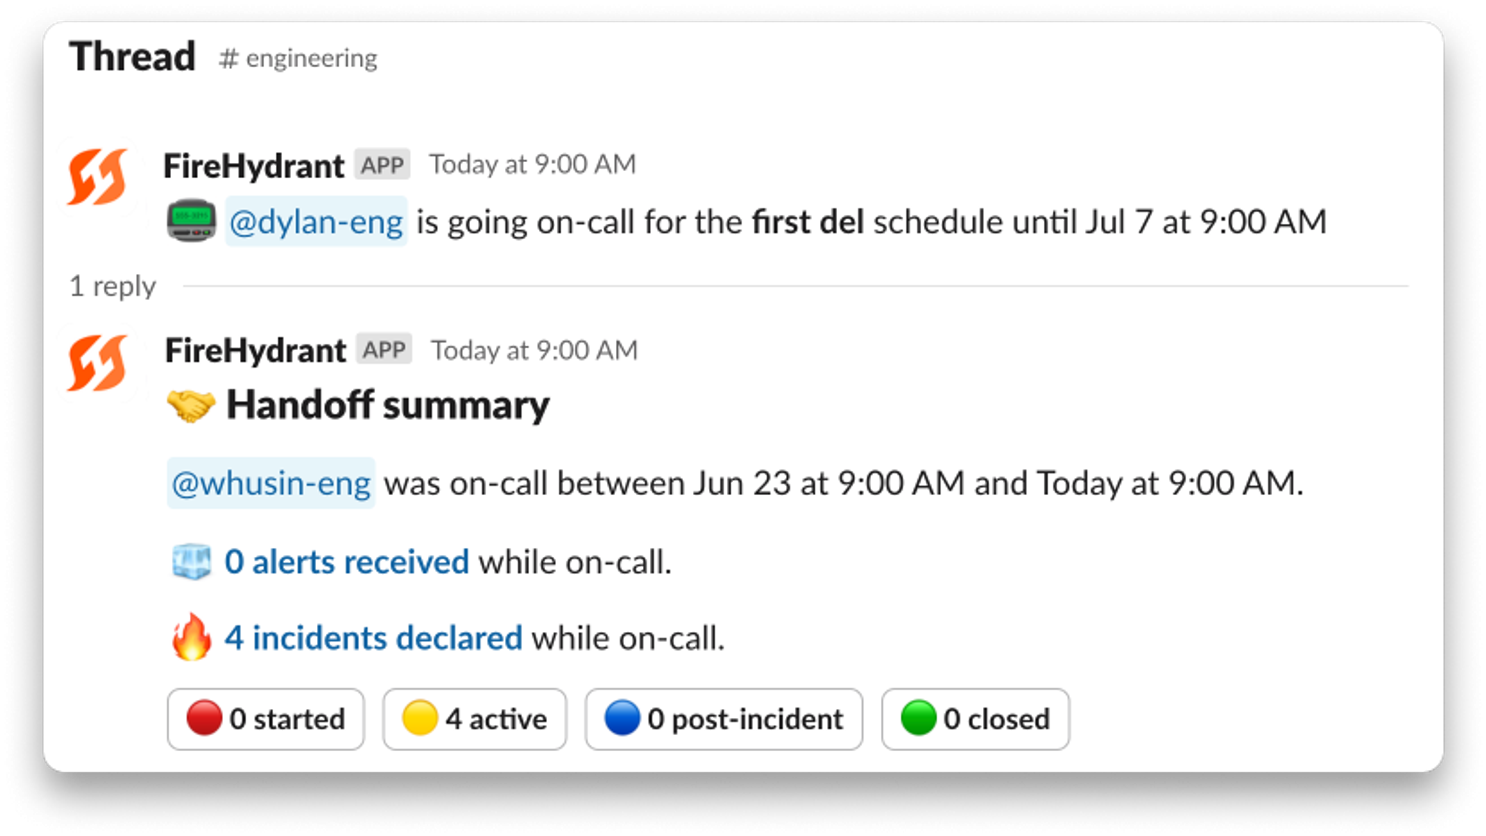
Shift changes shouldn’t feel like a game of telephone. Now, at the end of every shift, our Slack bot will send a DM to the incoming person on-call to provide the full summary of what’s been happening, so no one is going in blind.
This includes total alerts received and incidents declared, with links out to Team Analytics to dig in further.
🕳️Coverage Gap Notifications#coverage-gap-notifications
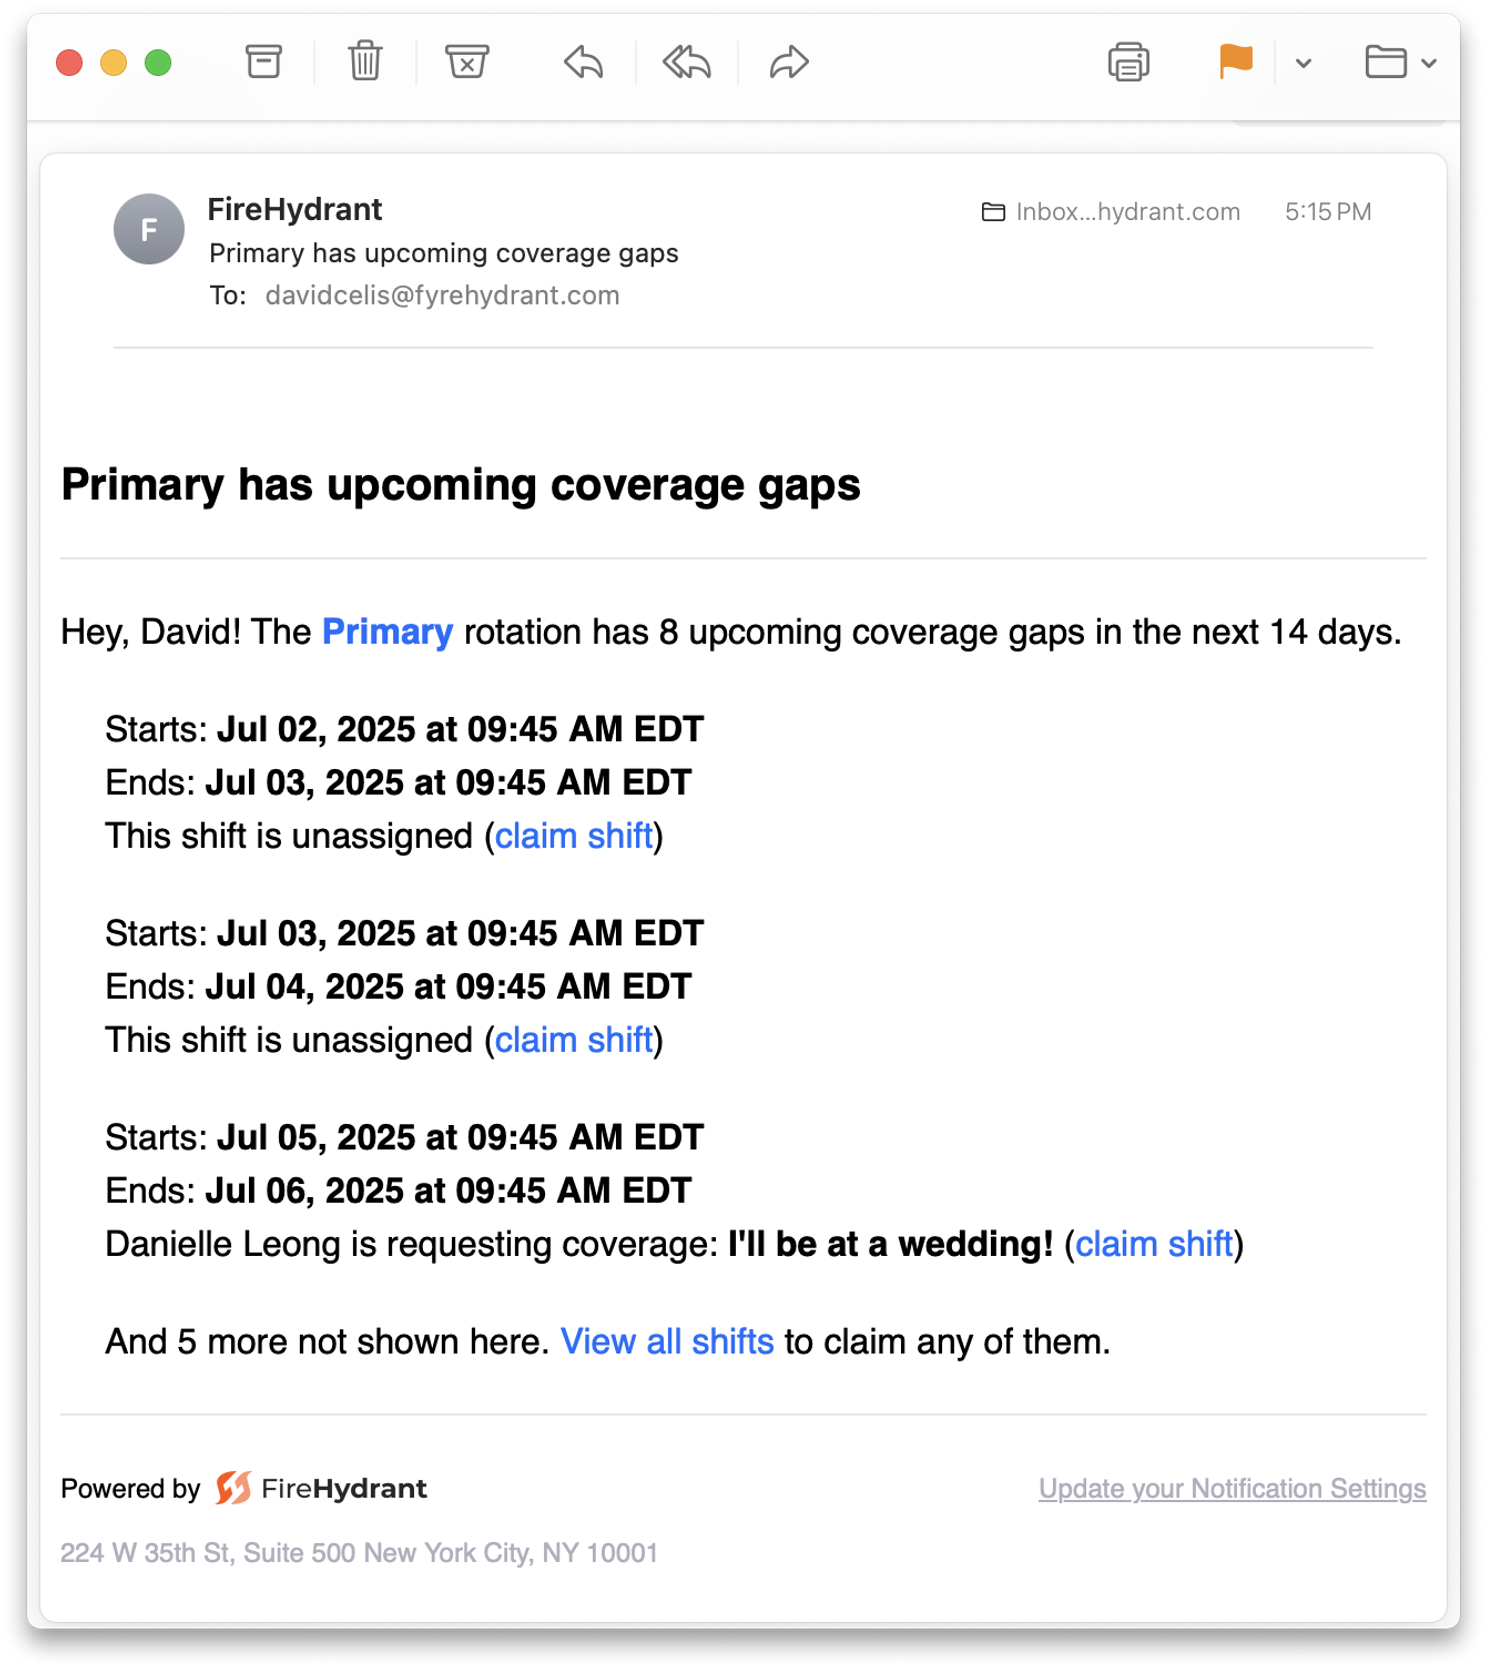
Mind the gap. Or don’t — we’ll flag it for you. Every day at 9am, Signals sends a Slack and email alert showing any unstaffed blocks in your on-call rotation, with links to fix them fast.
🚨 Alert Noise#alert-noise
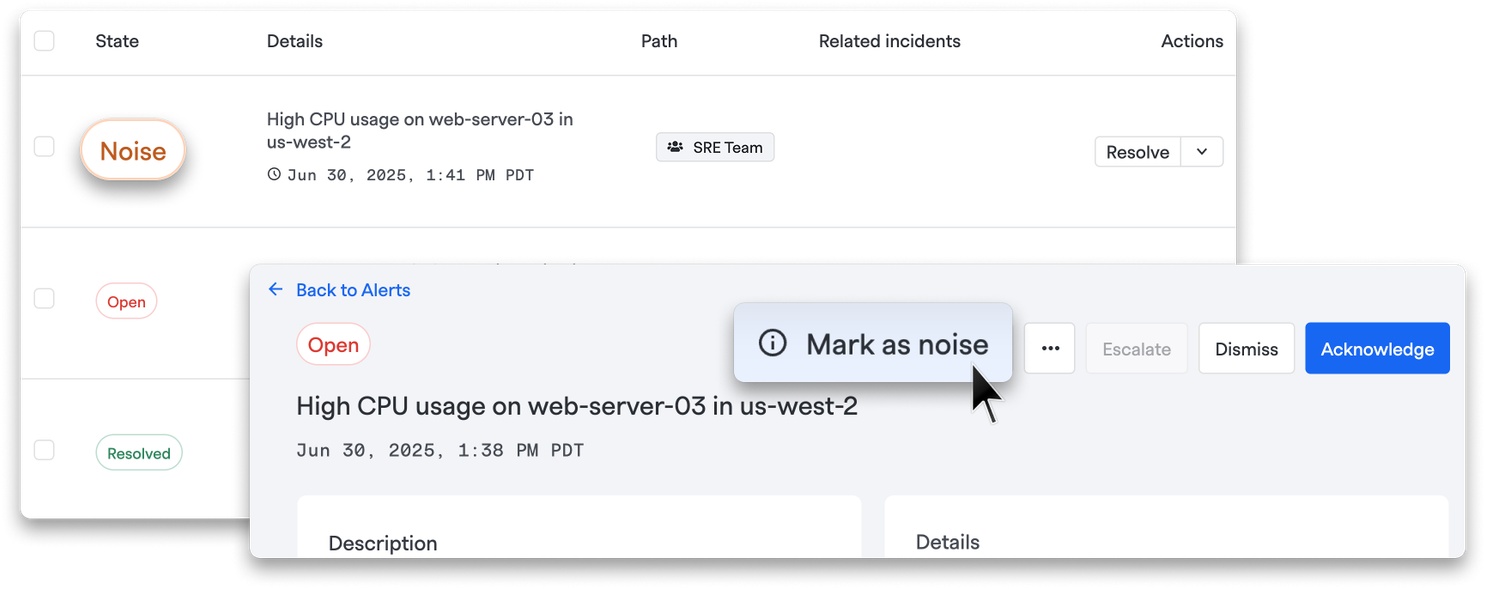
Alert fatigue is real — and this helps you fight it. Now, your team can mark alerts as noise directly from Slack or the UI, so you can start identifying which signals are worth waking up for (and which aren't). Every noise action is recorded in the alert’s timeline, showing who marked it and when — giving everyone shared context.
And when you mark an alert as noise in Slack, FireHydrant will reply in the thread — where you can also add extra context that gets saved to the timeline.
You can filter for noisy alerts, exclude them from views, and track alert noise over time in Team Analytics to get a clear picture of your signal-to-noise ratio.
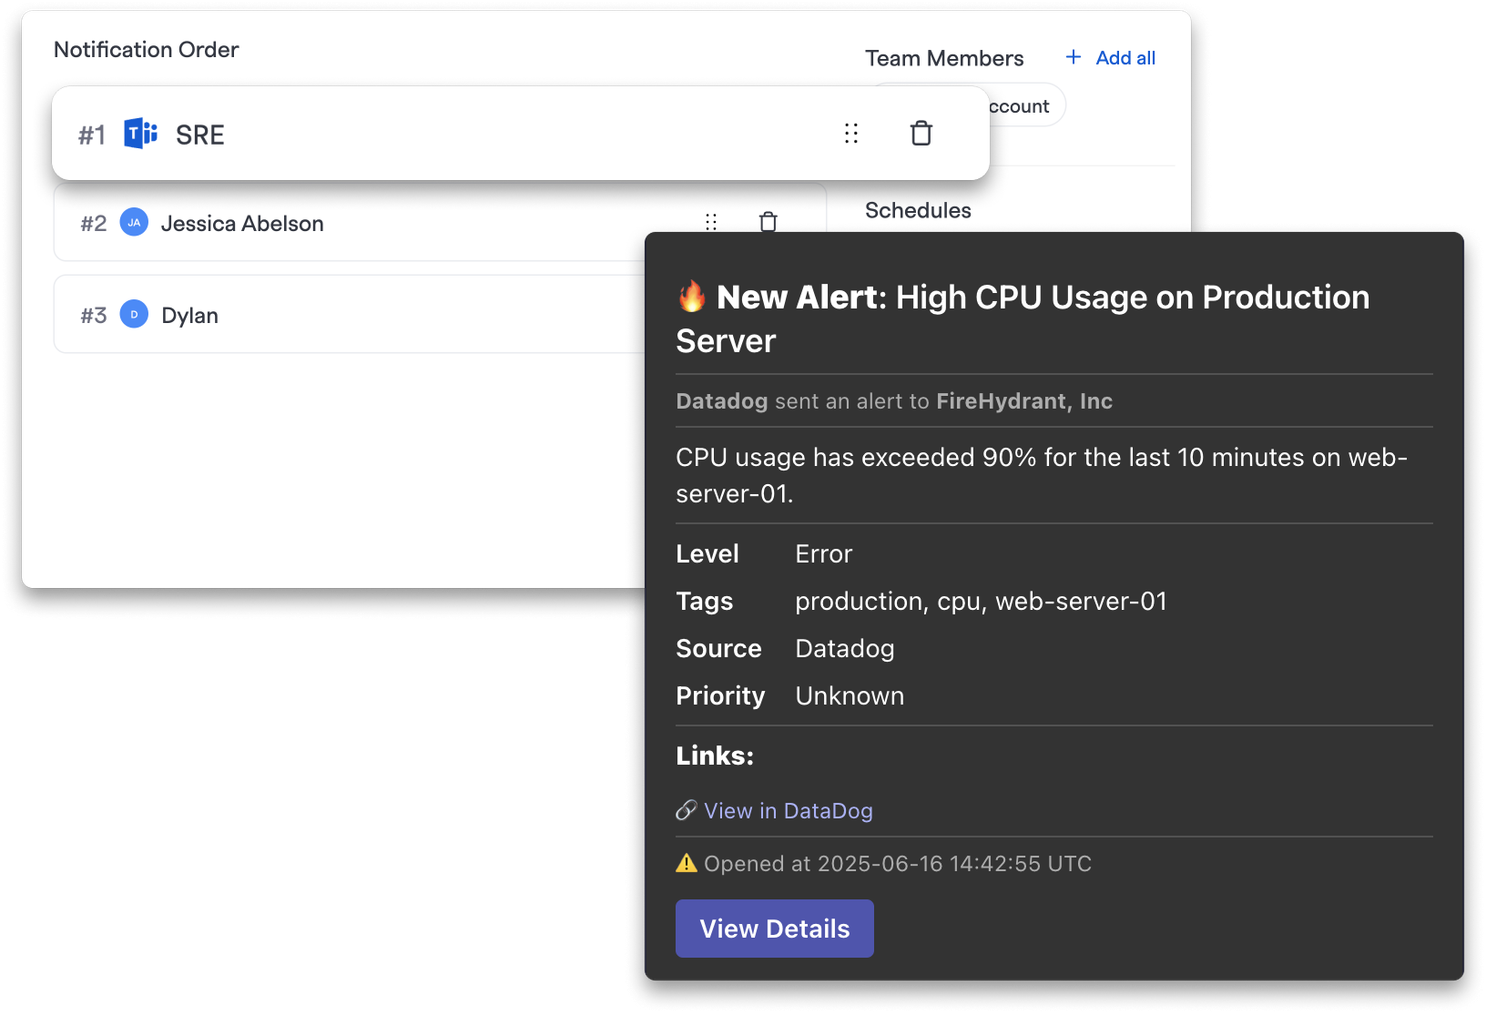
🔁 Alert Visualization#alert-visualization
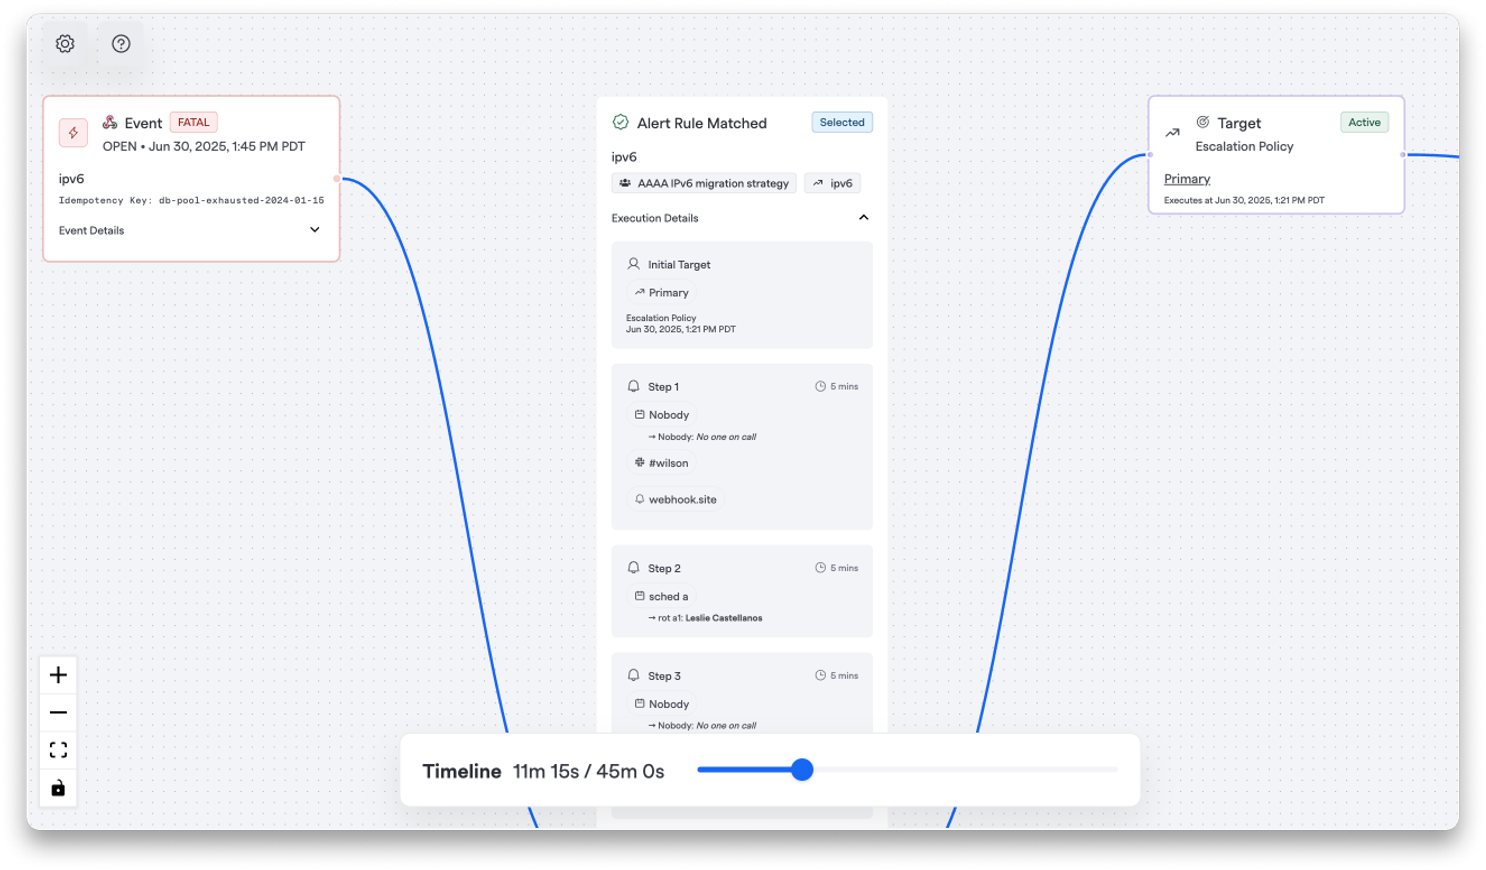
So you’ve set up your alert rules and escalation policies…but what does that really look like in the wild? Now you can see exactly how your alerts will behave before they fire.
Choose an existing payload (or drop one in) to see the full route your alert will take through your escalation policy: who gets notified, when, and on what channel. You can even change the time or date to simulate different routing scenarios.
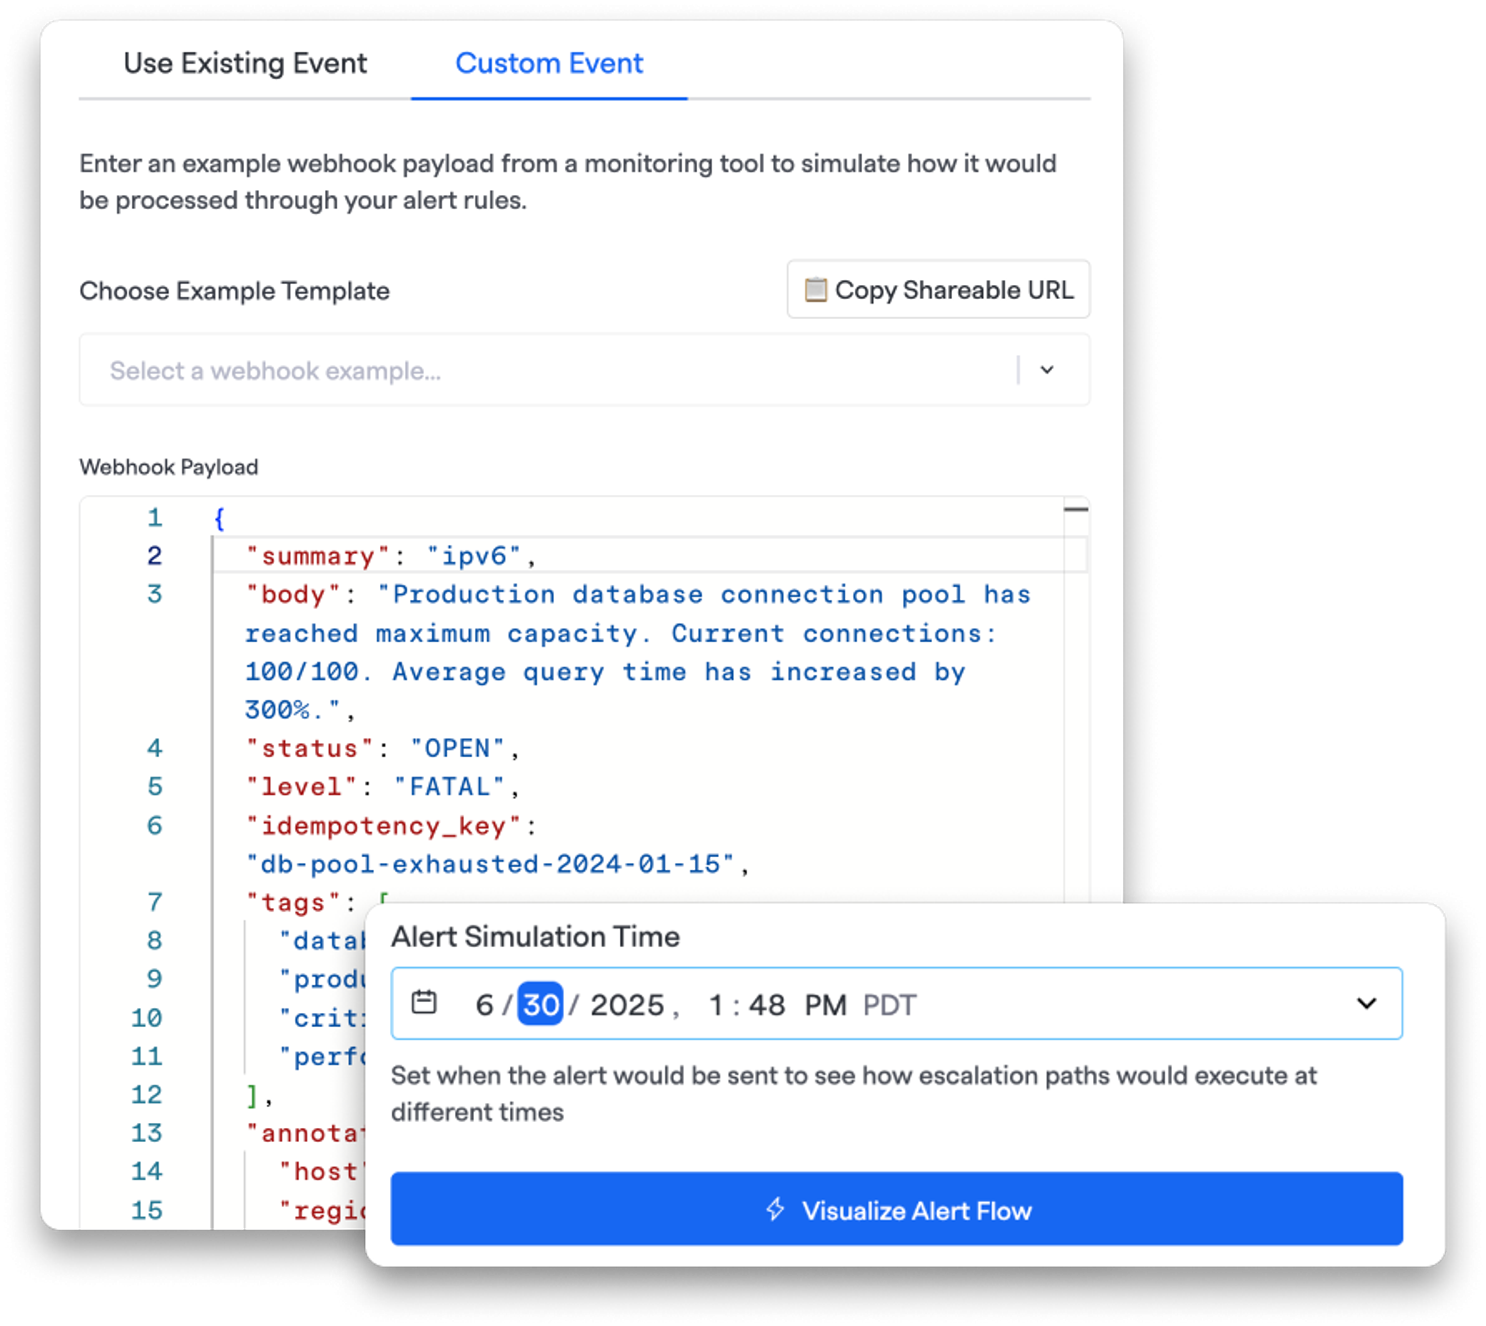
It’s the fastest way to catch misconfigurations, prevent alert fatigue, and make sure the right people are looped in at the right time.
Head to Signals > Alert Visualization to get started.
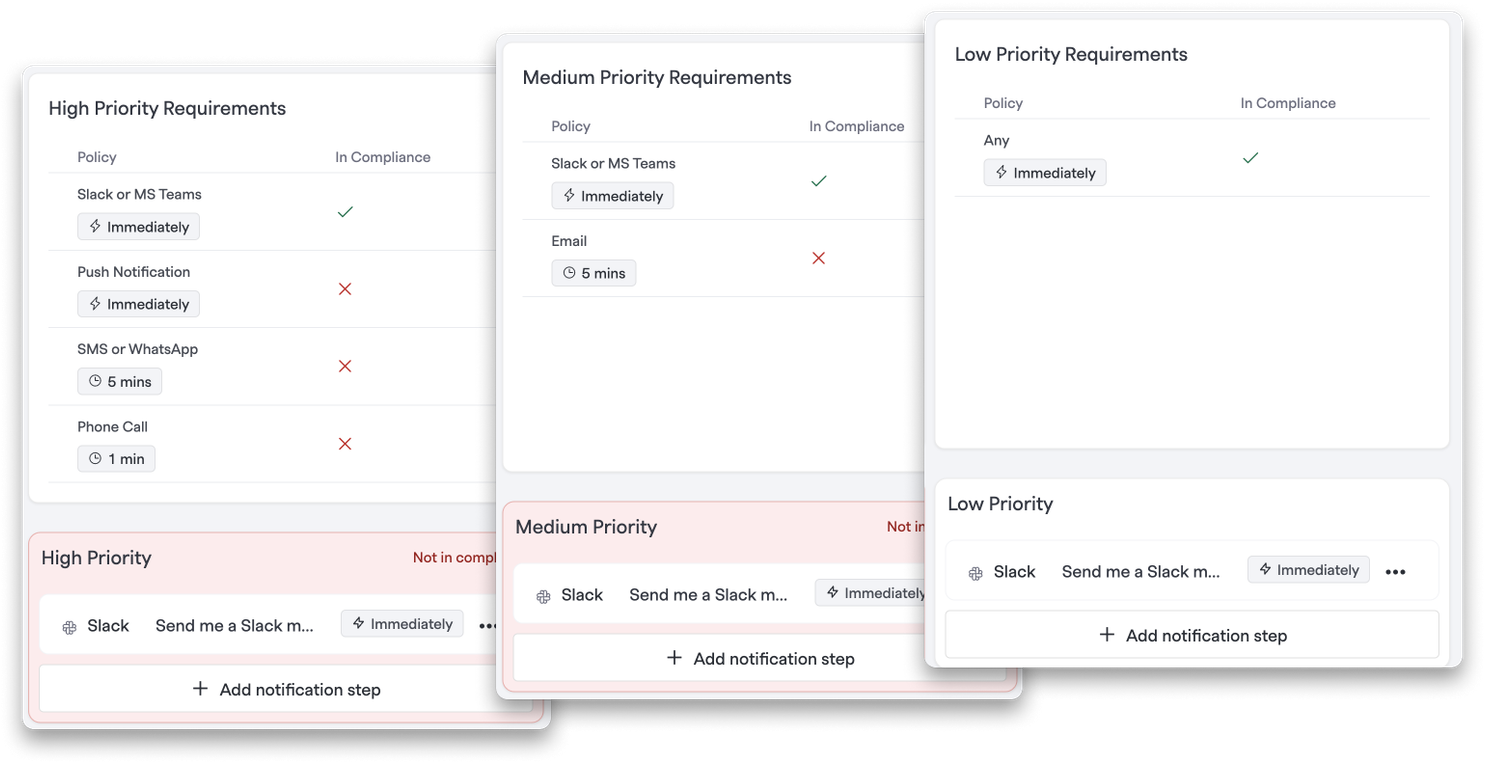
🔔 Notification Preferences Policy#notification-preferences-policy
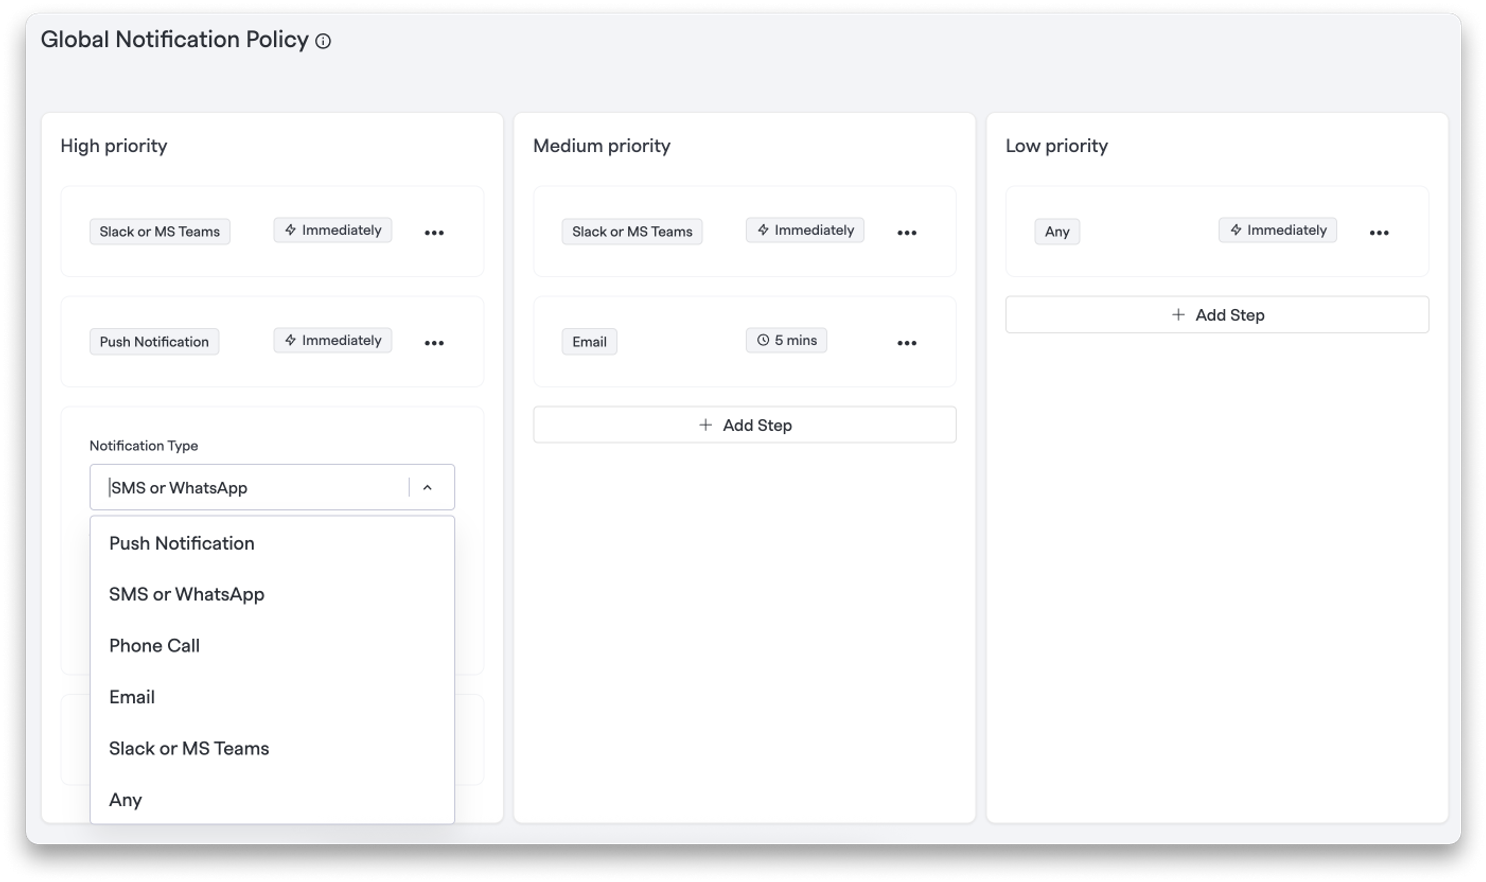
Get ahead of “I didn’t get the page.” Owners can now define different notification policies for high, medium, and low priority alerts — including delivery method and wait times — and see who’s in or out of policy across your Team page and user settings.
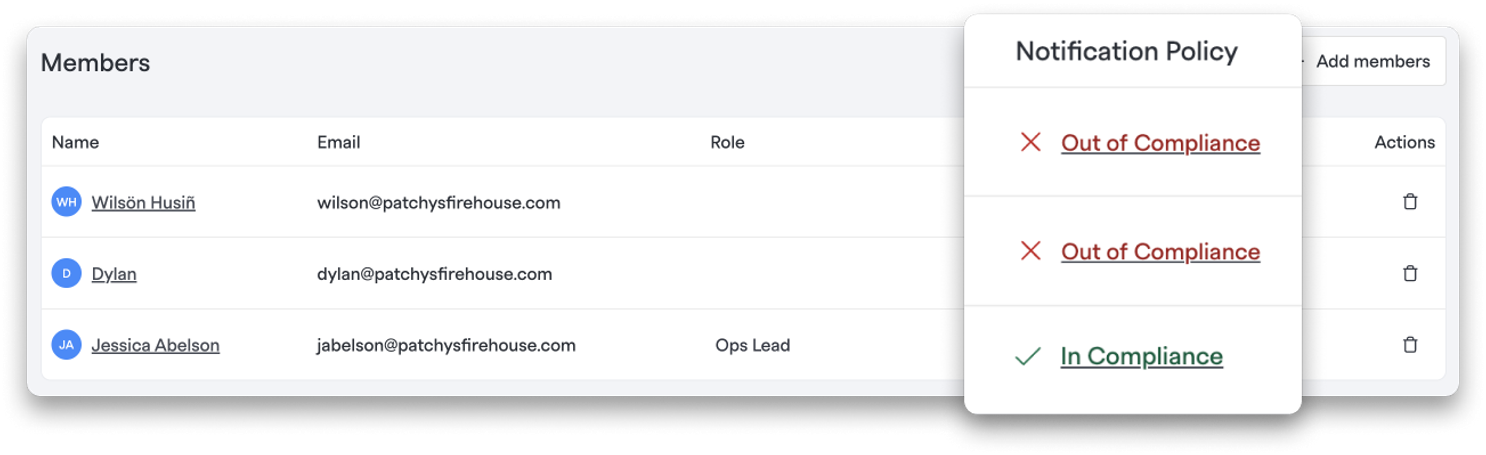
When setting up notification preferences, users will now see the preferred policies and whether their settings are in or out of policy and why.
For Owners, head to Signals > Notification Preferences Policy.
🛠 Signal Event Debugging#signal-event-debugging
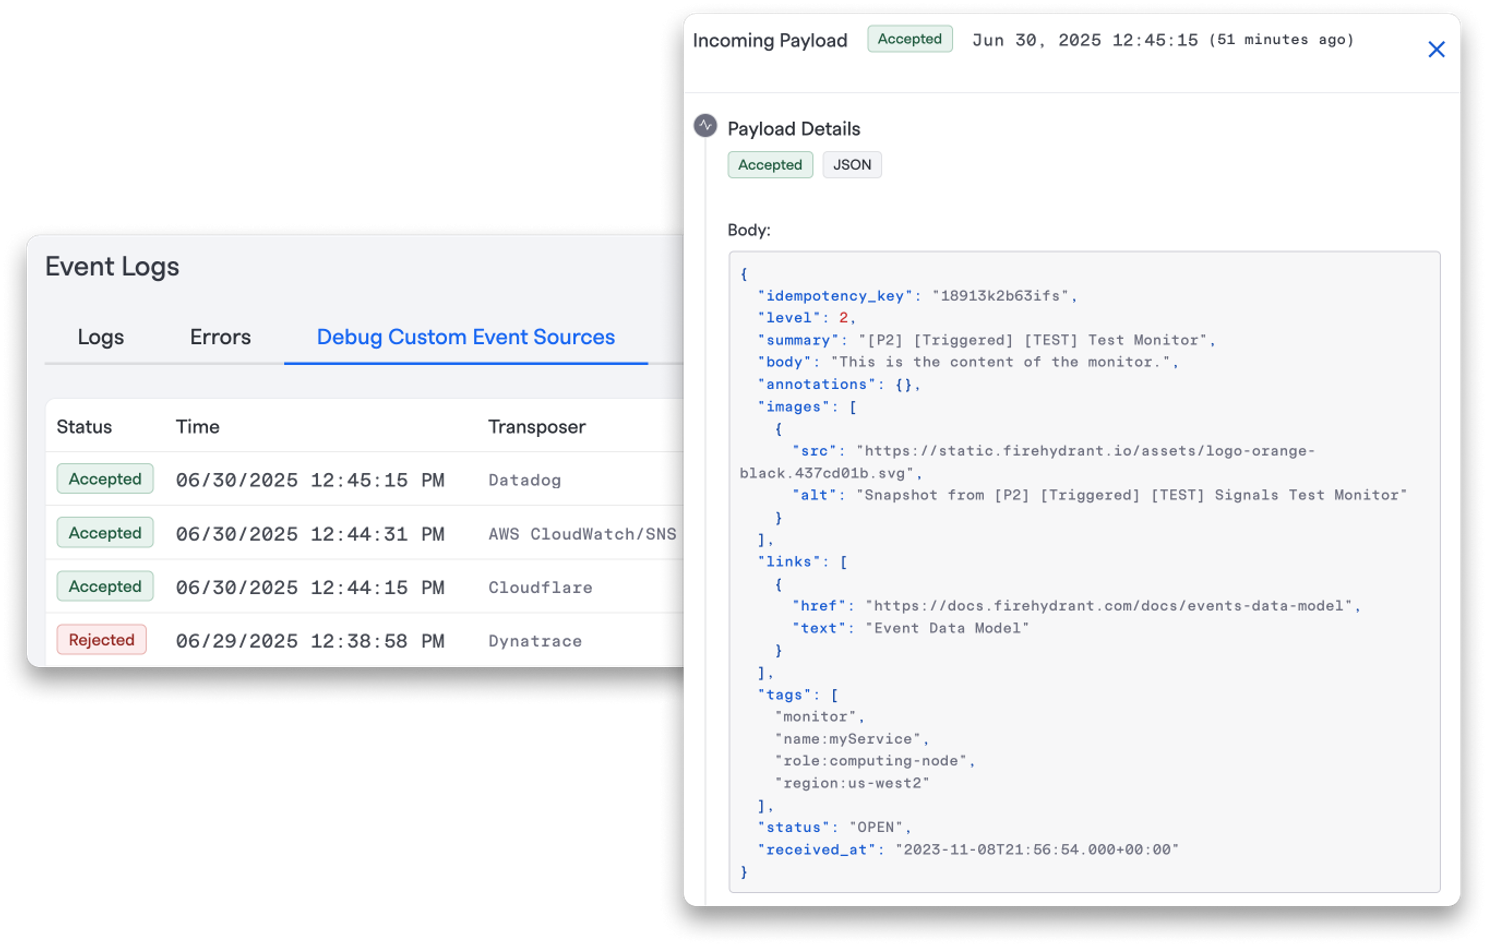
Debugging custom event sources shouldn’t be a huge headache. Now there’s a clear way to see what happened to every incoming alert — accepted or rejected. The new “Debug Custom Event Sources” tab within Event Logs shows all incoming payloads from your custom sources for the last 7 days, along with:
- Whether the event was accepted or rejected
- The full parsed payload received from the transposer
- A direct link to the created Signal (if one was generated)
You get full transparency into what came in, how it was interpreted, and what happened next.
💬 Signals for Microsoft Teams#signals-for-microsoft-teams
If your team lives in Microsoft Teams, your alerts should, too. We’re thrilled to announce that Signals now supports Teams channels and direct messages in escalation policies — so you can route notifications exactly where your people already are, no context-switching required.
All of This Adds Up to Something Bigger#all-of-this-adds-up-to-something-bigger
We’re not just adding features for the sake of it. We’re building toward a better system — one that’s team-oriented, data-driven, and actually enjoyable to use. The kind of tool that helps teams stay connected, feel supported, and operate at their best, even in the middle of the night.
Signals is the future of on-call. And this launch is a huge step toward that future.
Thanks for building it with us.