A powerful new incident analytics experience is now generally available for Enterprise customers
Automatically measure MTTR, impacted infrastructure, task completion, and more with new incident analytics.

Modern engineering teams have spoken: not only do they want to streamline and learn from incidents, they want to actually use them to improve reliability. Moreover, as economic winds change, teams want to understand the impact of their investment in incident management. To close that loop, they need a path to understanding incidents across time, infrastructure, milestones, and teams. Those insights are now generally available for FireHydrant Enterprise customers. Our upgraded Analytics dashboard makes it easier to understand at a glance how incidents affect your systems and your people, allowing you to drive toward true reliability improvements.
In addition to the updated dashboard, we’ve also made it easier to export visualized and raw data to share your incident management performance with leaders and other teams. Combined, these features allow teams to understand and share data about incident management programs in a way that was previously impossible in any tool without cumbersome data analysis and business intelligence work. For the first time, teams can instantly visualize incident impact by service, functionality, and teams without stitching together data from disparate sources, piping it into a BI tool, and manually building out queries and charts.
Tour the new Analytics experience#tour-the-new-analytics-experience
To get started with FireHydrant Analytics, navigate to the Analytics dashboard and use the Incidents and Impact tab and Resources and Tasks tab to start exploring your data. Optional filtering allows you to slice your data by multiple dimensions, including by time, infrastructure, milestones, and teams. Here’s a brief tour of what you’ll find.
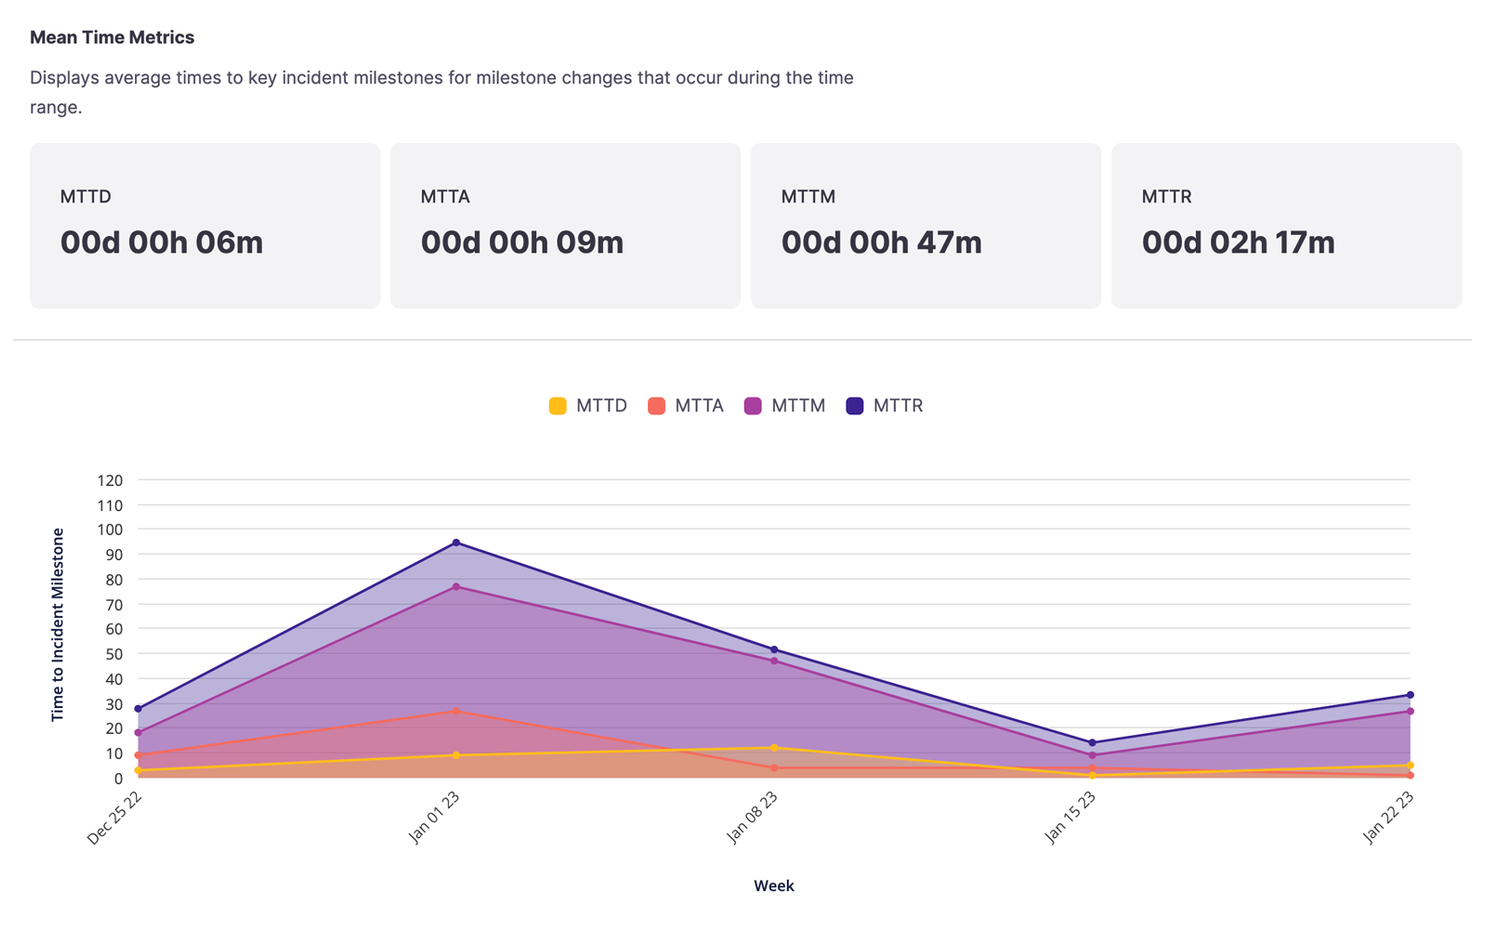
Mean time metrics
Go beyond resolution with stats for mean time to each milestone: detected, acknowledged, mitigated, and resolved.
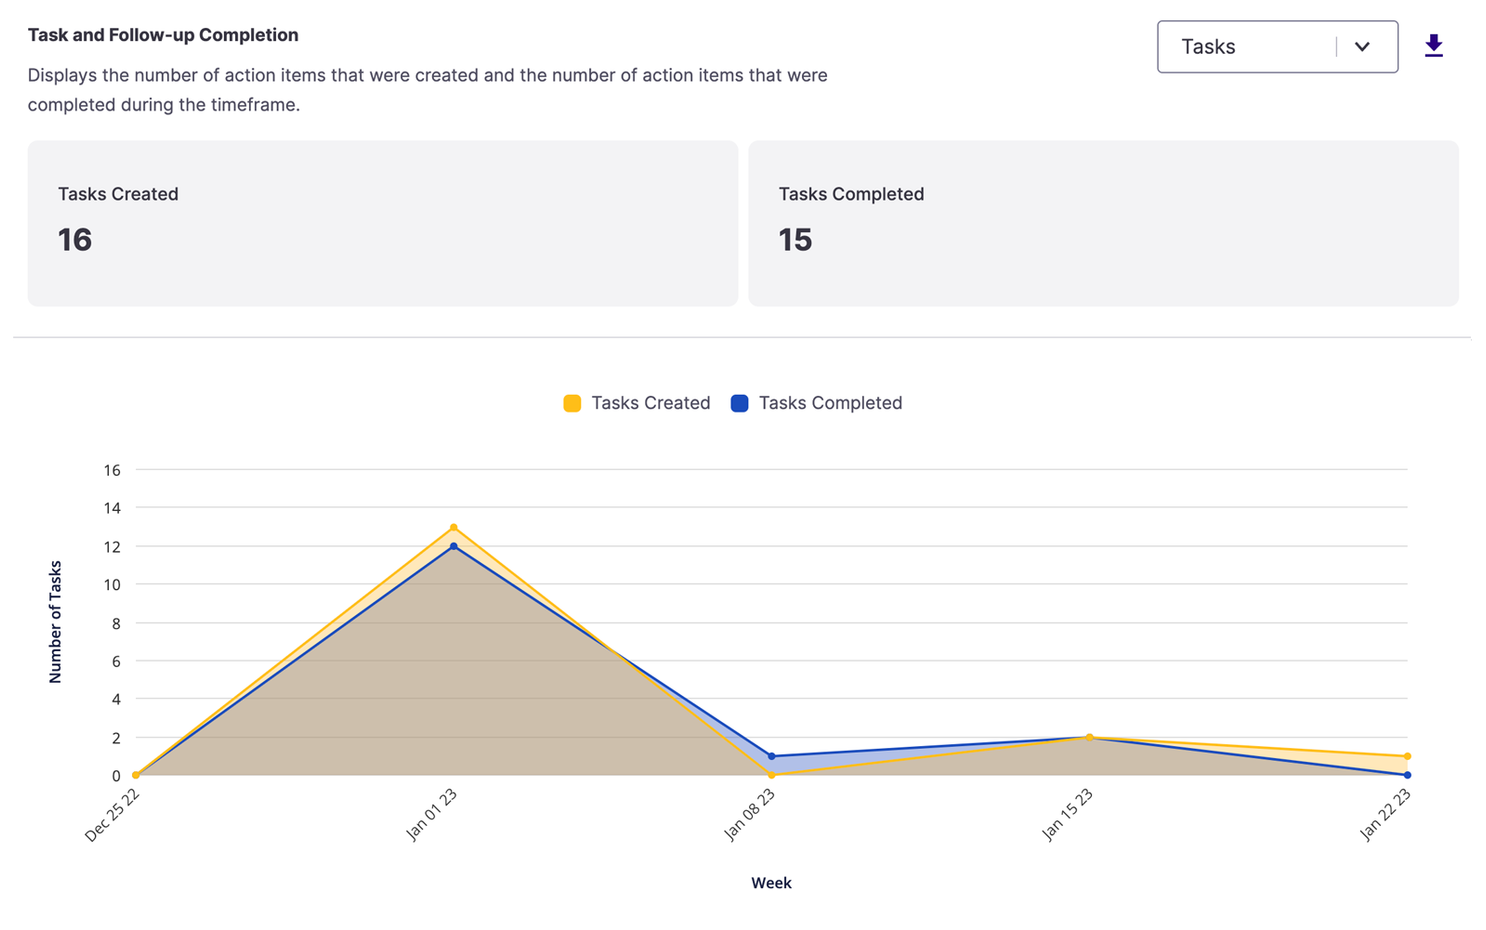
Task and follow up completion
Understand how incidents are driving system improvements by looking at the volume of tasks created and completed.
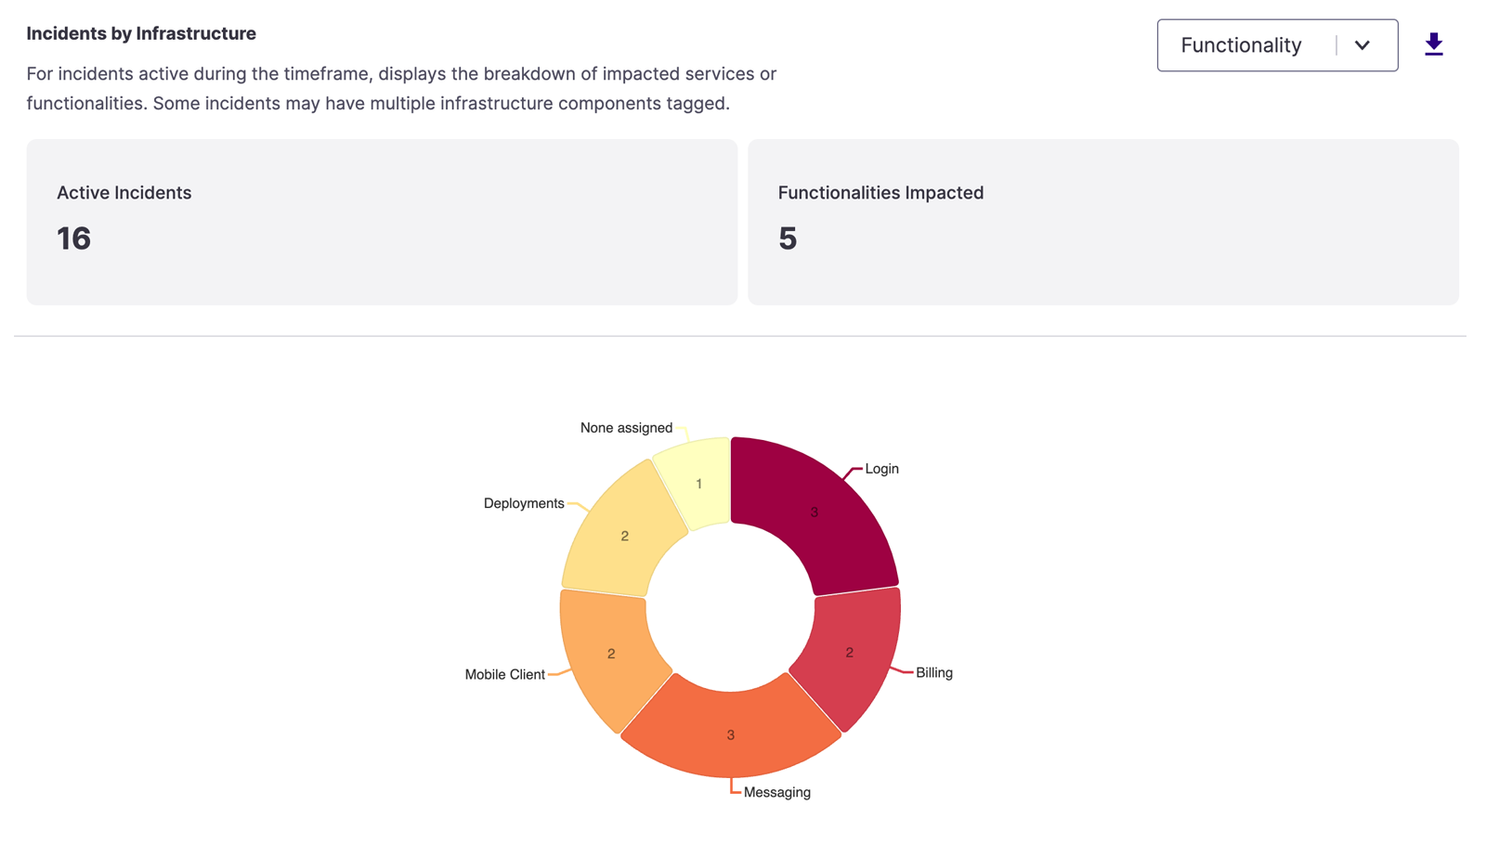
Incident by infrastructure
See what services and functionalities had ongoing incidents during a date range.
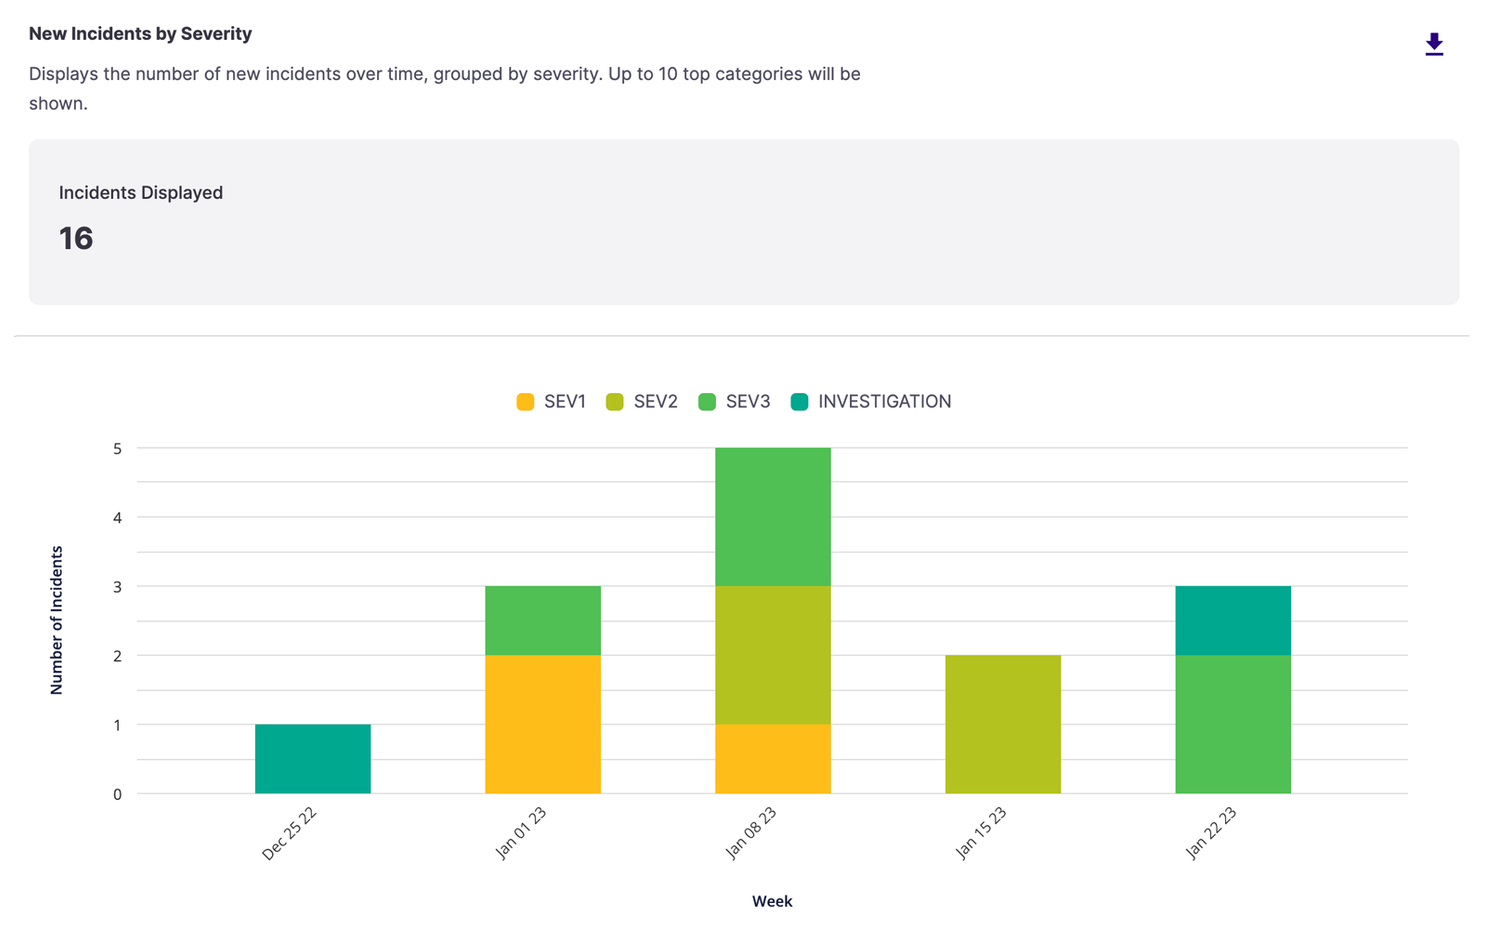
New incidents by severity
Understand severity trends for incidents created during a given date range.
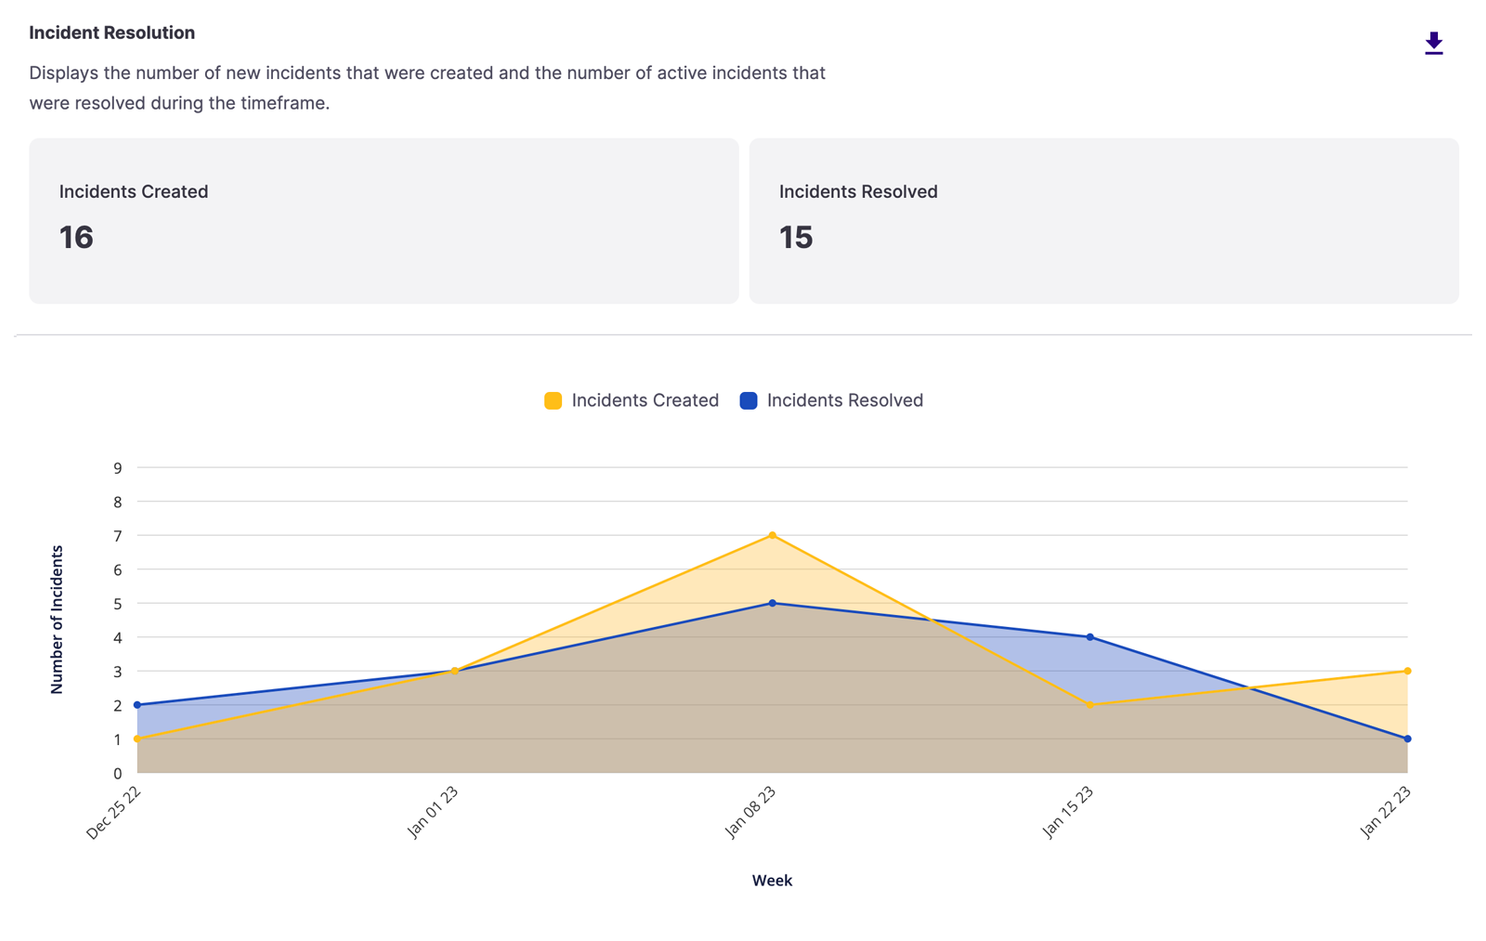
Incident resolution
Compare how many incidents are being created and resolved in a date range.
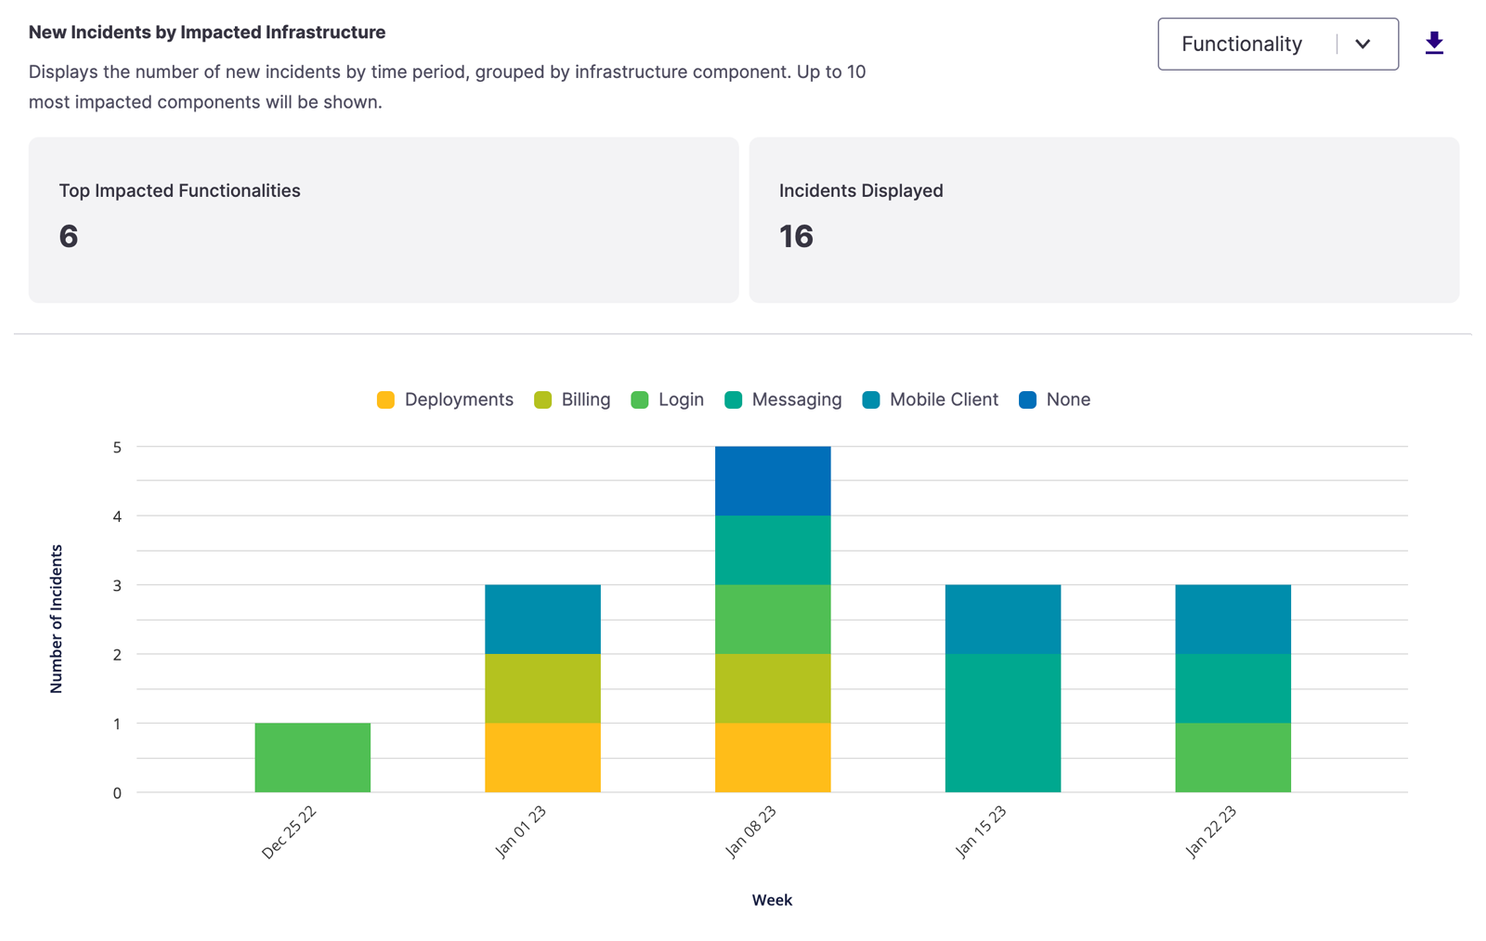
New incidents by impacted infrastructure
View incidents created over time, grouped by which services and functionalities are impacted.
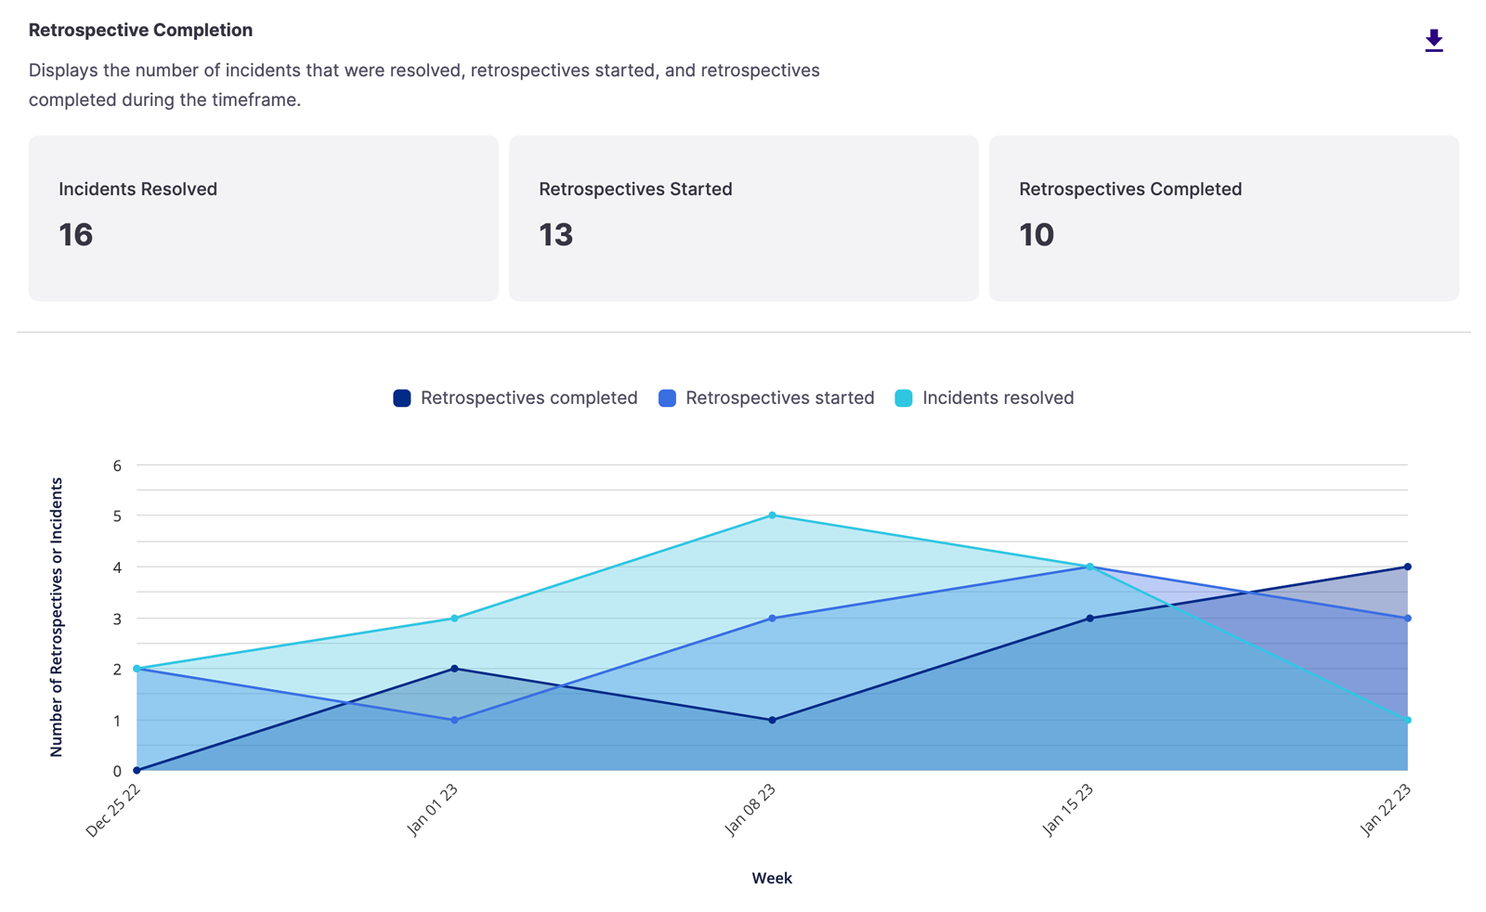
Retrospective completion
Understand your team’s retrospective habits, including the delta between started and completed retrospectives.
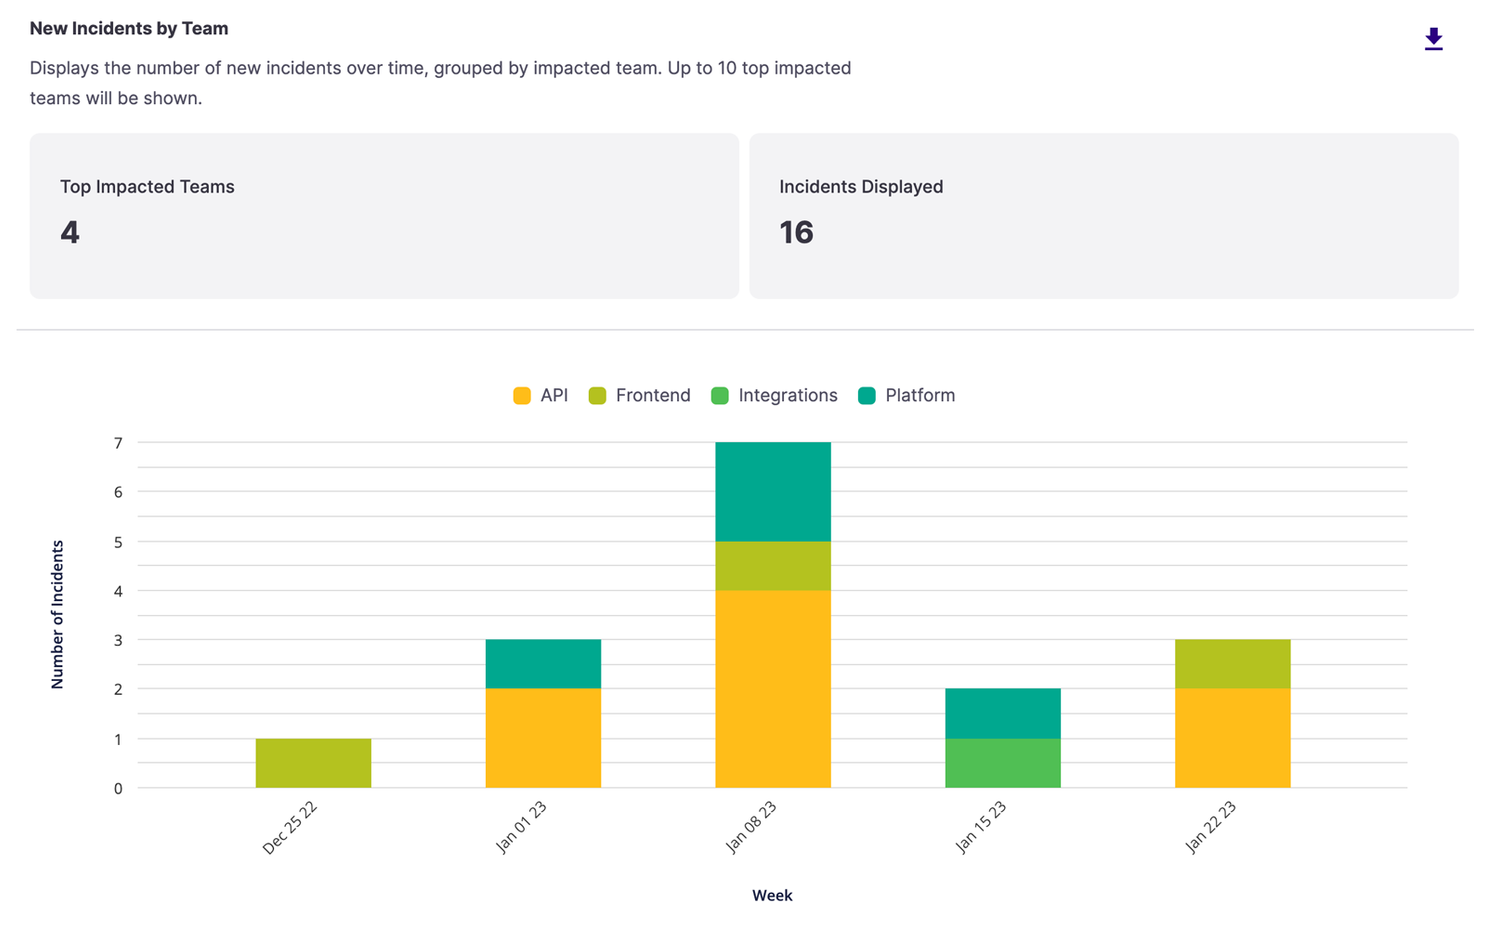
New incident by team
Spotlight burnout risks and single points of failure with insight into how incidents affect teams.
FireHydrant Free and Essentials users will still have access to basic analytics and tabular data.
Getting the most out of your incident management investment
We know that many teams, engineering included, are going into 2023 with less certainty about budget, headcount, and programs. One of the best ways to ensure important programs are supported is to be able to effectively speak to and justify their impact. Beyond providing your leadership with a path to make reliability investments, the new FireHydrant Analytics dashboard is a step toward arming you with actionable data that can tell a story about your investment in incident management. If you’re interested in driving more efficiency and consistency in your company’s incident management program, we’d be happy to chat about how FireHydrant can help. Give us a shout.