Inside the gamedays: how we tested Signals for reliability
FireHydrant is mission-critical infrastructure for thousands of engineers. It’s our job to be up – even when everything else is down. Here's a technical look at how we tested Signals alerting and on-call to ensure high availability and speed.

TL;DR we threw everything we had at Signals in a series of gameday tests. We can comfortably deliver:
- 99.99% compute and uptime SLOs
- 143 requests per seconds (without any horizontal scaling)
- mission-critical alerts even if our primary monolith fails
- 47x speed improvement over early tests
- Multi-region with zero downtime
FireHydrant is mission-critical infrastructure for thousands of engineers. It’s our job to be up – even when everything else is down. Never has that been more true than with Signals, our alerting and on-call management tool. We knew from the beginning that each architectural decision we made should optimize for resilience, scale, and speed. We chose to build with Kubernetes, Go, and Temporal for maximum reliability and a lightning fast experience. And we built on Google Public Cloud to leverage multi-gateway cluster management. But there was only one way to find out whether we built a truly reliable product: a brutal gauntlet of tests that pushed the system to its edge. This is the story of how we did it – and how it performed.
Setting the north star#setting-the-north-star
When testing for reliability there are any number of KPIs you can optimize for. But we had no interest in vanity metrics. We needed a starting point that would help us reveal hotspots and weaknesses so we could attack them while the product was still in beta. We started with a target that has at some time or another haunted every engineer on our team (and probably every engineer who has ever been on call): Signals would need to stay up even if us-east-2 failed, forcing an alert for every single FireHydrant customer at the same time. Using this as a starting point, we designed a battery of tests that would challenge different components of our system and different customer configurations. We also needed to build a product that we had so much confidence in that we could use it as our own mission-critical alerting and on call tool, which would mean world-class resilience and failover paths.
We followed the same process for each game day we ran: define a clear goal, run a series of tests, analyze the performance, and take action to harden our system. We want to give you visibility into what’s driving Signals’ reliability, so this post will take you through each of the game days in detail.
Gameday #1: Single org to a single user#gameday-1-single-org-to-a-single-user
As this was the first major performance test of Signals (outside of local testing), we wanted to keep it simple: one organization, one user, one escalation policy. The goal was to set a baseline for how our system would perform under load and identify any initial issues with our architecture.
We tested email and SMS delivery as follows:
- Single org, email alert - 240 workers sending 1 req/second with a total of 8000 requests
- Single org, email alert - 260 workers sending 1 req/second with a total of 8000 requests
- 3 orgs, SMS alert - 234 workers sending 1 req/second with a total of 7992 requests
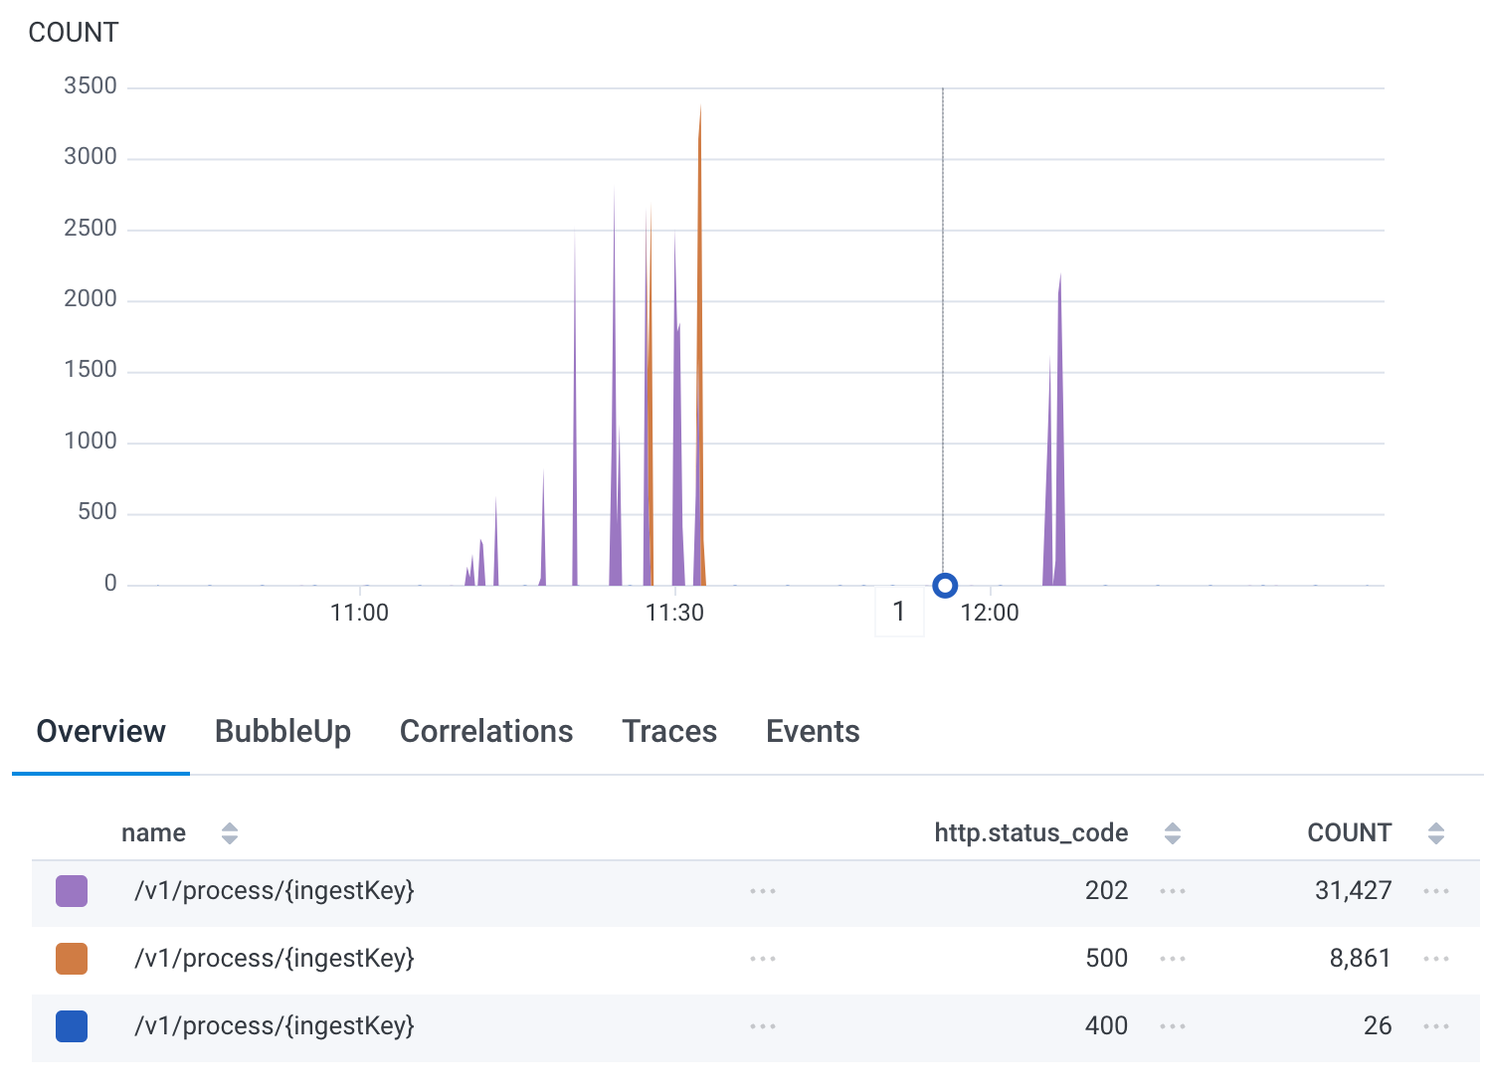
Total requests and status codes during the initial test.
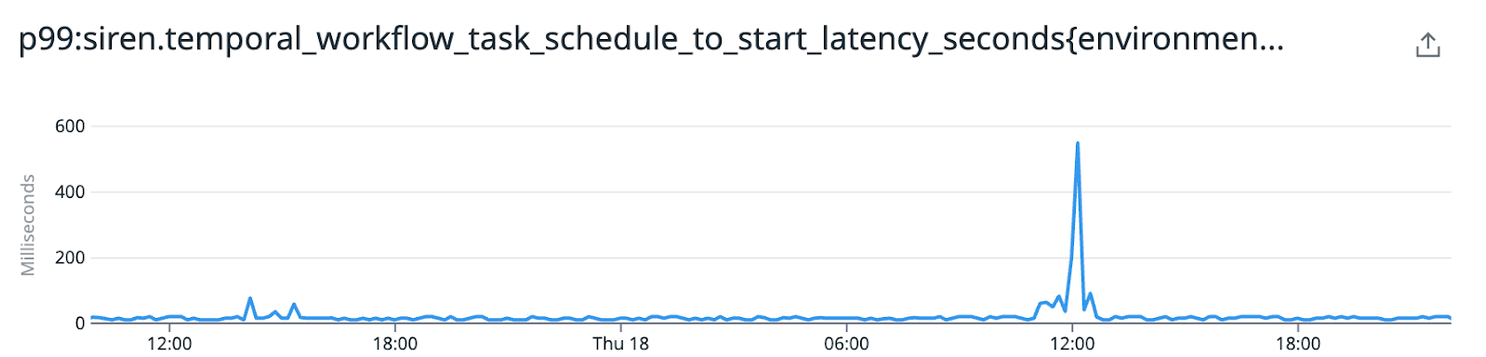
Latency spike in workflows starting indicating that we need to tune our rate limiting.
All requests we sent were accepted with a 202, meaning that neither the ingress nor the API server deployment itself were a bottleneck. Our initial test didn't reveal any performance concerns for our base case, but it did reveal where we'd need to implement adjustments to our model and our Temporal (our durable execution provider) settings in order to more effectively test production-level traffic. And we knew going into it that a single organization with a single user is neither complex nor reflective of how our actual customers use our product (multiple orgs with multiple users on multiple teams with complex escalation policies). This test simply reinforced that we needed to go further.
In our initial data model, we were streaming events to a long-running Temporal workflow. Temporal keeps a historic log of every action performed within a workflow and there is a strict limit on the length of this list. In order to keep the number of retained log entries manageable, these workflows are “continued as new” (basically, a restart) on a regular basis. Exceeding a certain amount of entries will trigger this. Workflows also have a limit of 10,000 Temporal events that can be received throughout their lifetime. If this is exceeded, they’ll stop processing new events until the workflow is restarted.
Without proper throttling, these workflows don't have a chance to restart under heavy load. The inbound events just keep coming as long as the load test is active. Eventually, we hit the workflow’s maximum Temporal event limit. So, we began investigating better ways to manage workflow queues so we could clear backlogs and manage retries more efficiently.
Lastly, we determined that a single organization could likely ingest far more alerts than a typical user would find useful (getting paged hundreds of times when you already know there’s an issue doesn’t seem helpful), so we implemented rate limiting accordingly while ensuring that the initial alerts were still delivered in a timely fashion.
Gameday #2: Multi-region failover#gameday-2-multi-region-failover
Multi-region support is table stakes for distributed software, especially if you’re building mature systems that need to serve global teams. Our second test was designed to tell us what would happen if our primary datacenter failed and we needed to failover to another region. This would help us define our uptime SLO and give us a recovery path in the case of a disaster.
We challenged load balancing, database failover, and Temporal cloud performance.
Compute/load balanced gateway.
While under constant load, we killed the pods in one cluster to test whether traffic would automatically transfer to the other as expected. And, huzzah, that’s exactly what happened.
Database
Next, we tested how quickly we could replicate and failover our primary database if it failed. We manually promoted the read replica of the database, then reconfigured the app and rolled all pods. We measured the time from start to all pods available. Pods in all Kubernetes clusters were removed to preserve data integrity, then the cross-region database replica was promoted to read-write. Since the test was fairly straightforward, we wanted to push a bit further and see what would happen if we did something unusual. So, the secret was updated to switch back to the original database and pods were cycled without being fully shut down. In both tests, things performed as expected.
Temporal cloud
For Temporal cloud, we wanted to simulate the disaster scenario of it becoming unavailable. In that case, we'd have a lot of broken pods since they'd be pointing to a service that either wasn't responding at all, or was responding very poorly. At that point, we would swap the configuration that told the pods where to find Temporal and then restart all the pods, since they only look for that information on startup.
Since Temporal cloud wasn't actually broken, we initially shut all of the pods down (breaking the primary Temporal cloud connection everywhere), then brought them all back up with the new connection. We did this so that we didn't have some pods connected to the old Temporal cloud namespace and others connected to the new one. This makes sure that we don't have work that started in one Temporal instance and then couldn't be connected because we were suddenly connected to another. Signals performed exactly as expected regardless of which Temporal cloud region it was connected to.
As much as we love a good opportunity to dogfood Firehydrant, there’s really nothing better than a boring gameday. With successful tests across the board, we were able to define our compute and uptime SLOs as 99.99%. Multi-region is a go.
Gameday #3: Multi-org with complex escalation policies#gameday-3-multi-org-with-complex-escalation-policies
Now that we’d established our foundations were strong and scalable, it was time to perform tests with scenarios that looked like our actual customer use cases (read: much more complex). Our goal was to find bottlenecks that we could iron out before launch, so we went with a scenario about as complex as it gets:
For each organization, we assumed:
- 3 teams
- 2 schedules per team: primary, secondary
- 1 rule per team for catch all to team
- 1 escalation policy per team with 3 steps (two schedules and with a terminal user step), 5 minute delay between steps
- Every minute, send 4 signals concurrently, one for each team and one that doesn't match
And for each alert, we wanted to:
- Escalate the alert 2 minutes after open
- Let stage 2 timeout
- Ack the alert after 10 minutes open
We started with the same amount of traffic as our first gameday to see how a more complex load test would perform. We flooded the system with a tidal wave of tests (29,000 to be exact) that ran the workflows end-to-end. Our system could manage all of them without error. But, our goal isn't to simply run without error, it's to be lightning fast. We identified a number of bottlenecks in our workflow architecture that we targeted for improvement.
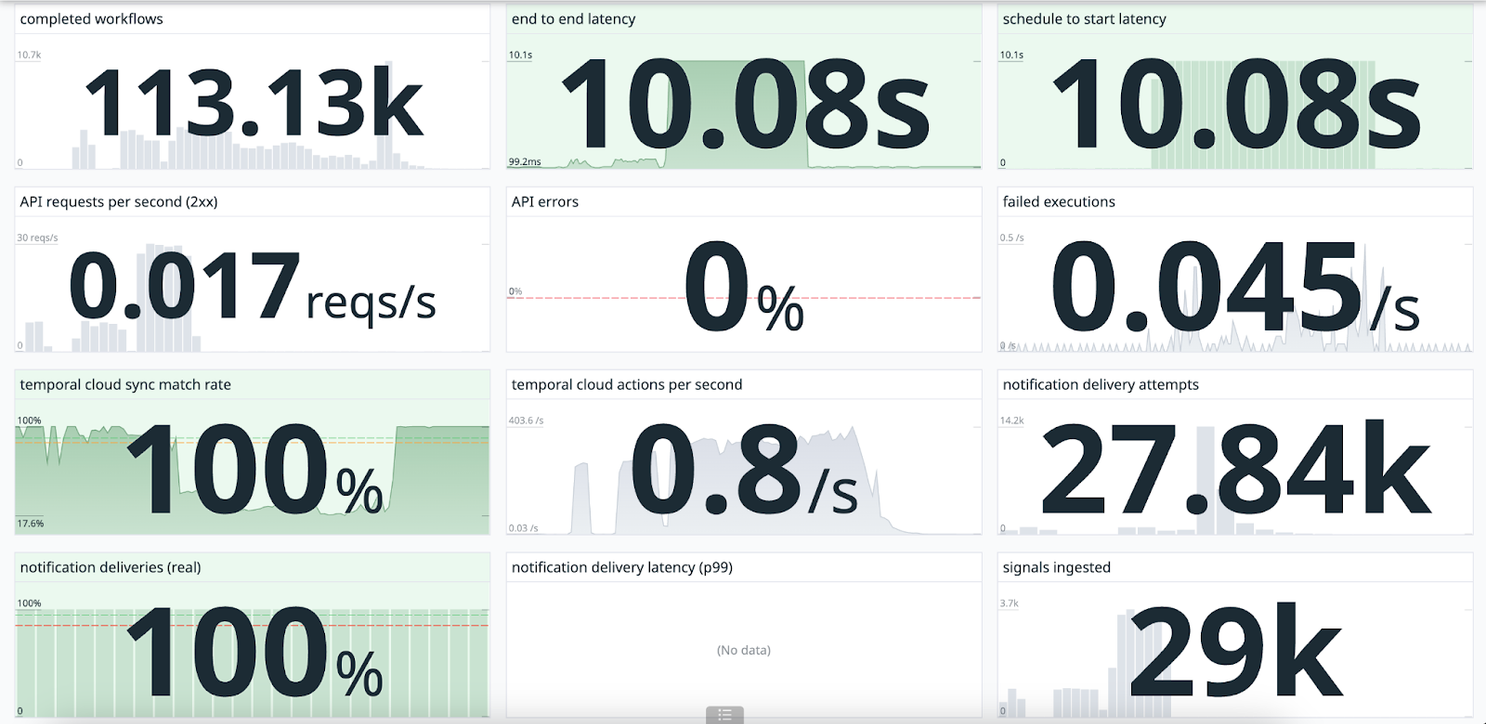
We flooded the system with a tidal wave of requests and it resulted in zero errors.
We suspected that with a flatter architecture we could remove bottlenecks and improve our alerts-per-second threshold. We ran an updated architecture design by the good folks who built Temporal and they were jazzed by the improvements. We also began working with them weekly to tune our Temporal configurations so we could maximize ingested alerts per second.
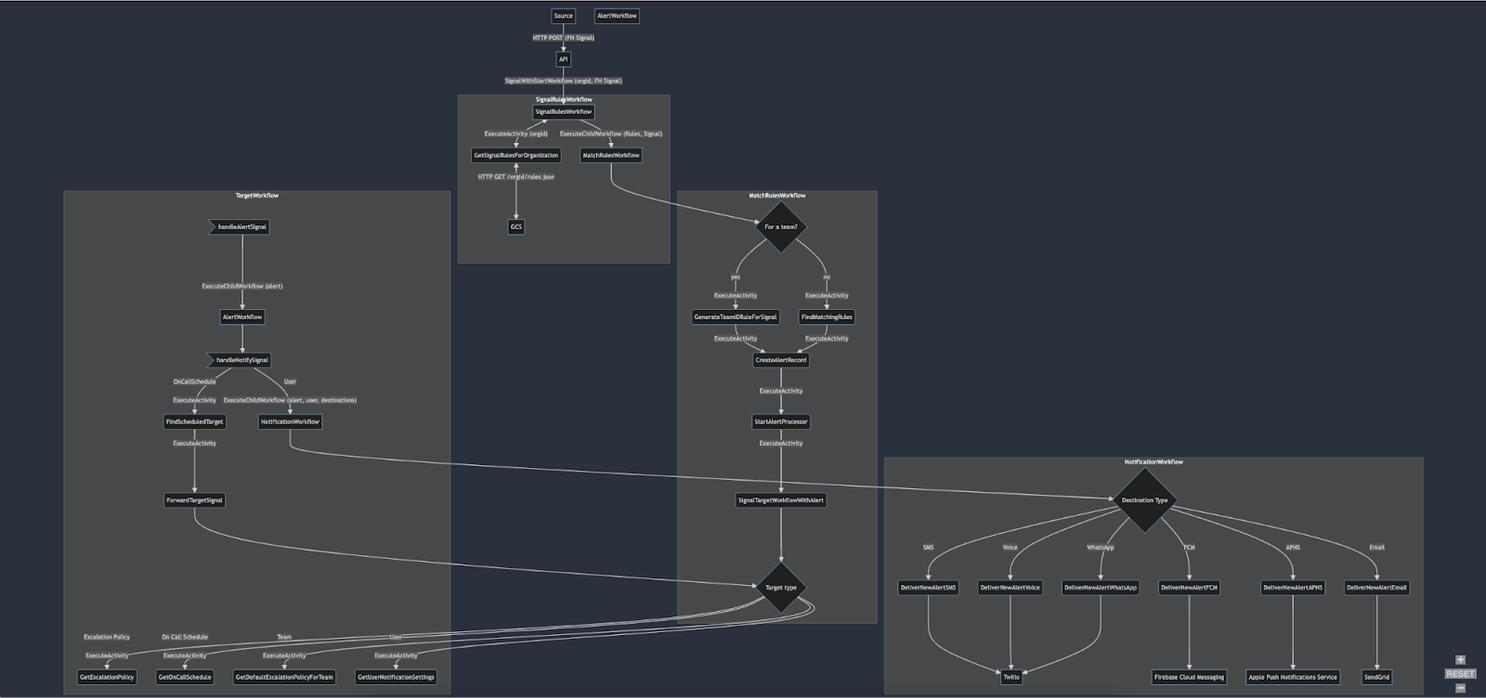
Previous architecture
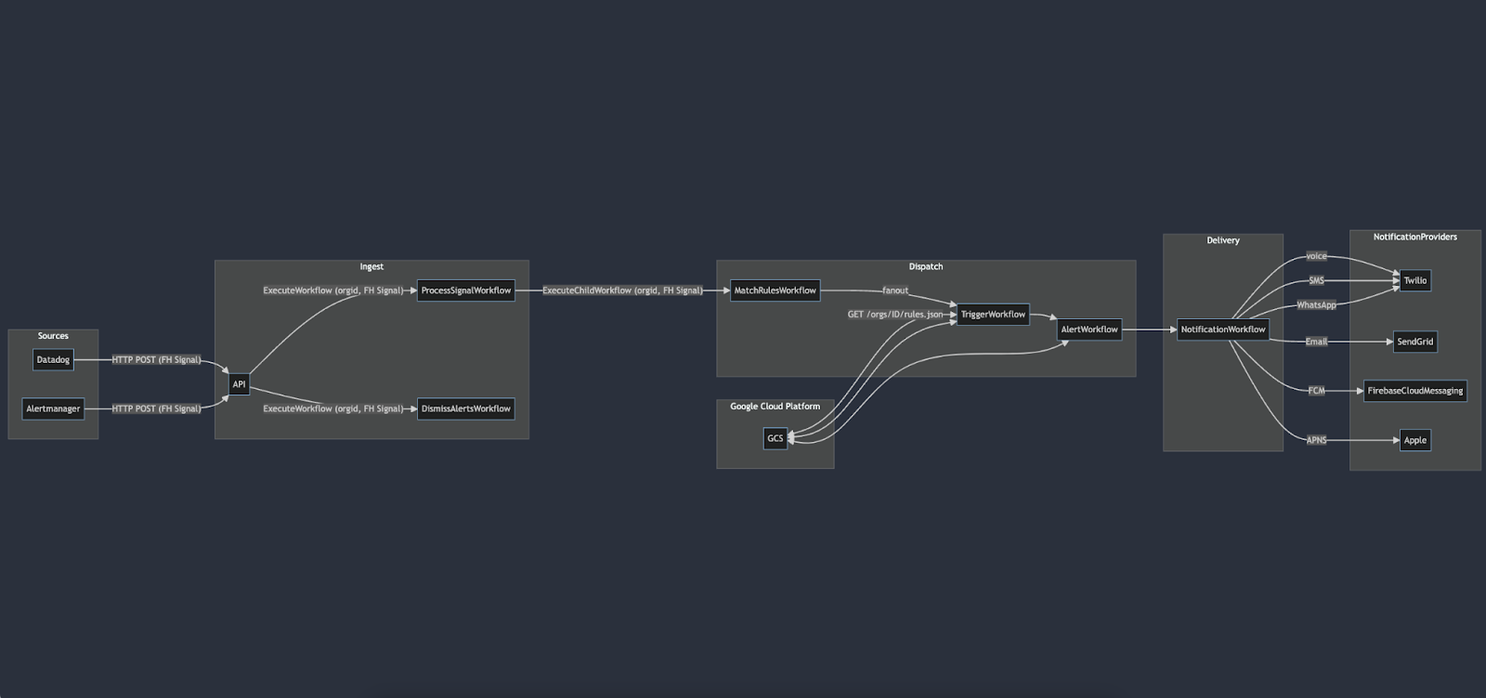
Flattened architecture:
Gameday #4: Microservice resiliency#gameday-4-microservice-resiliency
Since FireHydrant handles the full spectrum of incident management, the product has a fairly large surface area. As such, we needed to make sure that if for some reason any part of our codebase was having issues we could gracefully degrade without being hard down. And importantly, validate that alerts coming from the siren microservice are received and actionable even if our primary monolith, laddertruck is unavailable.
We took laddertruck offline and tested sending and acknowledging the full suite of notifications Signals offers: SMS, voice, email, WhatsApp, Slack, iOS app, and Android app. We confirmed that we are able to successfully deliver mission-critical alerts even if laddertruck goes down.
Gameday #5: Pushing it to the limit#gameday-5-pushing-it-to-the-limit
For our fifth and final gameday before launch we wanted to throw everything we could at our system. Our first test pounded the system with twice the number of alerts our large pool of active beta customers were expected to send in a month. We delivered those requests 99.3% faster than our stated SLA of 5 minutes.
Our next test pushed the volume up to 12x our expected monthly request traffic. We threw ten of thousands of events at the system over 5 minutes and all alerts were delivered within 2 seconds at a rate of 143 requests/second.
It was incredibly exciting to see the results of our technology choices, Temporal tuning, and flattened architecture pay off with an off-the-charts improvement in speed. Okay, not completely off the charts: the final test clocked in at 47x faster.
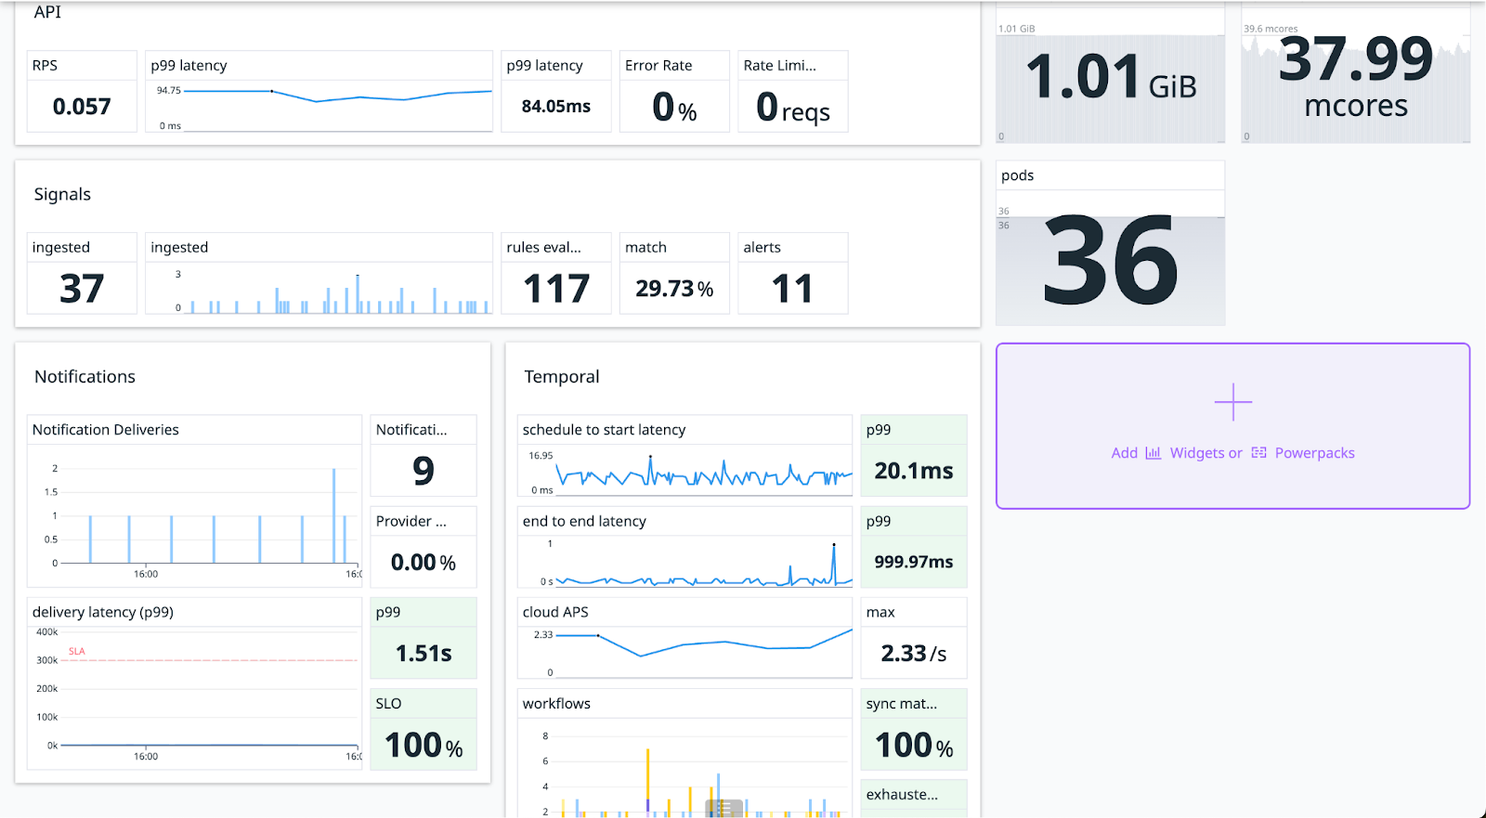
Hard work paying off with a 47x increase in requests-per-second alert delivery!
What happens next?#what-happens-next
After a battery of pressure tests we can confidently say that our platform performed gracefully under pressure. We’re incredibly proud of the hard work that the team has put into designing, creating, and testing such a resilient, scalable alerting product. Now it’s time to go even further. We built these tests on dramatic multipliers of our current planned traffic – but that number is growing every day. Signals is already being used in production by large, diverse engineering teams at several companies. Many more are actively running trials. We’ll continue working closely with our customers to make sure Signals is out pacing their expectations and tightly with the Temporal team to tune performance. And of course, our planned work includes the next round of tests. We’re excited to continue to share these behind-the-scenes insights into our performance with you. If you have questions about Signals or just want to talk shop, give me a shout. Oh, and we’re also hiring :)