February 4th, 2021 Incident Retrospective
Between 2021-02-05 00:20 and 2021-02-05 02:44, FireHydrant experienced an incident resulting in delayed runbook execution steps (Slack channel creation, etc) and intermittent availability issues on app.firehydrant.io. This is our incident retrospective.

Between 2021-02-05 00:20 and 2021-02-05 02:44, FireHydrant experienced an incident resulting in delayed runbook execution steps (Slack channel creation, etc) and intermittent availability issues on our customer-facing application (app.firehydrant.io). A database migration was executed with the goal of significantly reducing read throughput on our primary datastore; the automation managing our migration process raised a misleading error resulting in manual intervention efforts and a performance degradation condition lasting approximately 90 minutes. This post describes the timeline, contributing factors, and changes we’ve made going forward to prevent similar failures in the future.
The Incident#the-incident
FireHydrant automatically applies database migrations, if present, during each deployment and they’re normally a non-event. While our engineers are aware of their impacts and take care to ensure that their application won’t have an impact on production traffic, the act of applying them is fully automated. We default to using CREATE INDEX CONCURRENTLY when adding indexes to existing tables and while applying migrations automatically doesn’t impact the performance of our site, their impact is limited to delaying the rollout of the newest revision of our application.
As with all code going into production at FireHydrant, code reviews are performed and it was determined that this migration would be safe to apply; a compound index would be created to improve the order of columns used in the most frequently-run query on the target table along with removal of the redundant index. Due to the table involved in this migration, an additional step was performed in applying the index to a copy of our production database to observe how long it would take to create, albeit under less load.
Our deployment automation wraps our migrations with a mutex to ensure that only one copy of the migration is being applied at a time and that we block the rollout of a new application revision until the migration completes. If another pod (100% of our infrastructure runs on Kubernetes) attempts to start with a dependency on that migration, we sleep and prevent the pod from being recognized as ready (process has started) and healthy (able to accept traffic) until the mutex is released. During this incident, we realized how confusing it can be if the expiration of the mutex timer raises an application error.
If a migration takes too long to apply (five minutes by default) we raise an error and the message is simply “execution expired.” Unfortunately, this can be interpreted as the migration itself having failed rather than just the timer on new pods starting up. If this error were to be ignored, the process would continue with the pods restarting and beginning a new five-minute timer until the migration completed.
We haven’t encountered this situation in over a year and it was unfamiliar to those involved in the deployment. Manual interventions were performed to terminate the creation of the index and recreate it by hand. A point to note is that we normally perform all migrations in a transaction so if any of the DDL statements fail, the entire migration is rolled back. CREATE INDEX CONCURRENTLY is not compatible with transactions in Postgres so we execute these outside of a transaction.
The migration mutex reached its five-minute timer leading to an application error being raised and relayed into a Slack channel monitored by our engineering team. An engineer responded immediately by terminating the CREATE INDEX but because this specific migration was not performed within a transaction, we couldn’t roll the entire operation back. The existing index was dropped without a replacement and at this point application performance slowly began to degrade but actions were still executing within an acceptable amount of time.
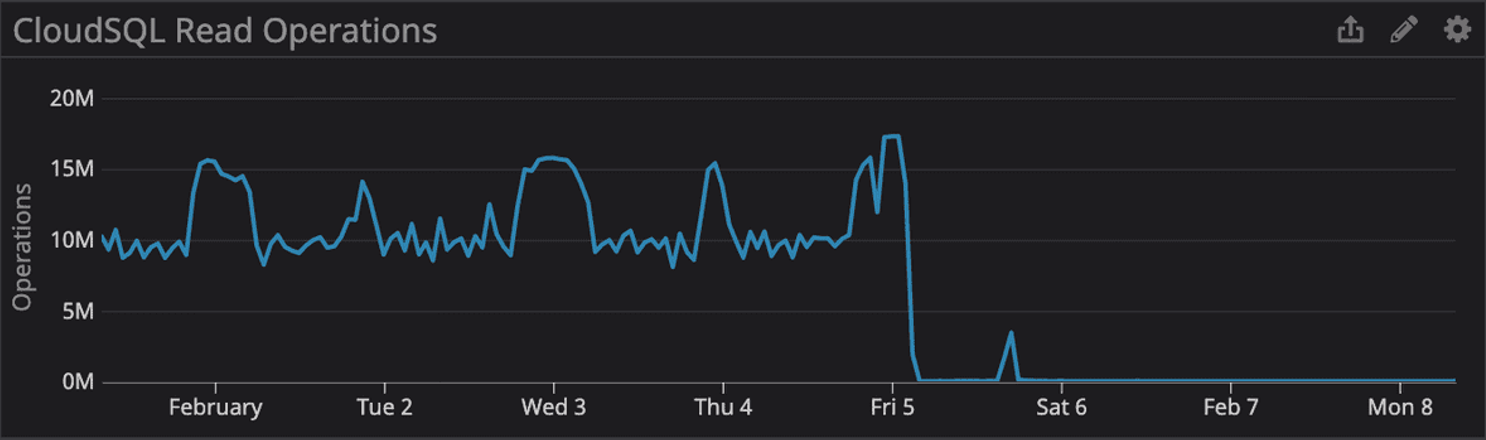
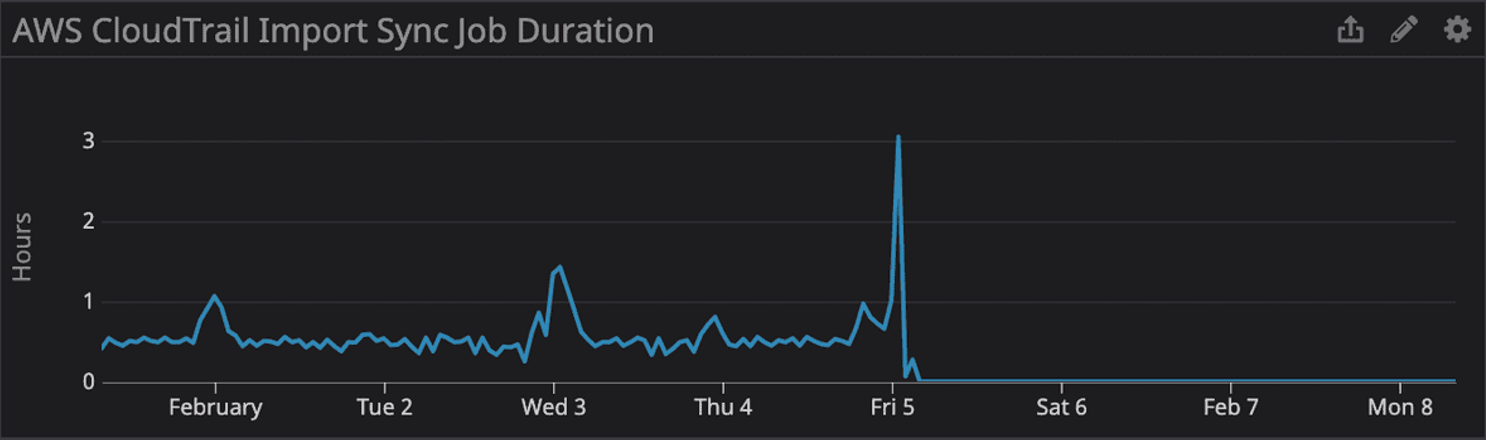
The functionality that depends on the target index only runs every ten minutes, per tenant; it’s part of our feature to ingest AWS CloudTrail events. While the execution of these jobs increased the read operations on our primary database server but it wasn’t enough to trigger any alerts or impact application performance by a significant amount by itself. It was only when these jobs began to consume the majority of our available background job processing capability did we see a severe impact on application performance.
A follow-up mitigation step was performed to terminate the creation of the index while working under the assumption that its processing was causing the application performance problems. This further delayed recovery as we had to drop the index and restart its creation from the beginning. Once the index was successfully created about seven minutes later, overall application performance returned to normal and we finished working through the delayed runbook step executions. The performance of our CloudTrail ingestion pipeline also demonstrated the expected improvements, leading to overall reduced read operations and CPU utilization.
Timeline#timeline
2021-02-04 21:10 Deployment went out with a migration to update indexes on one of our largest tables, mapping change events to pieces of infrastructure
2021-02-04 21:27 The index that would eventually become redundant was dropped prematurely, triggering the increase in job latency
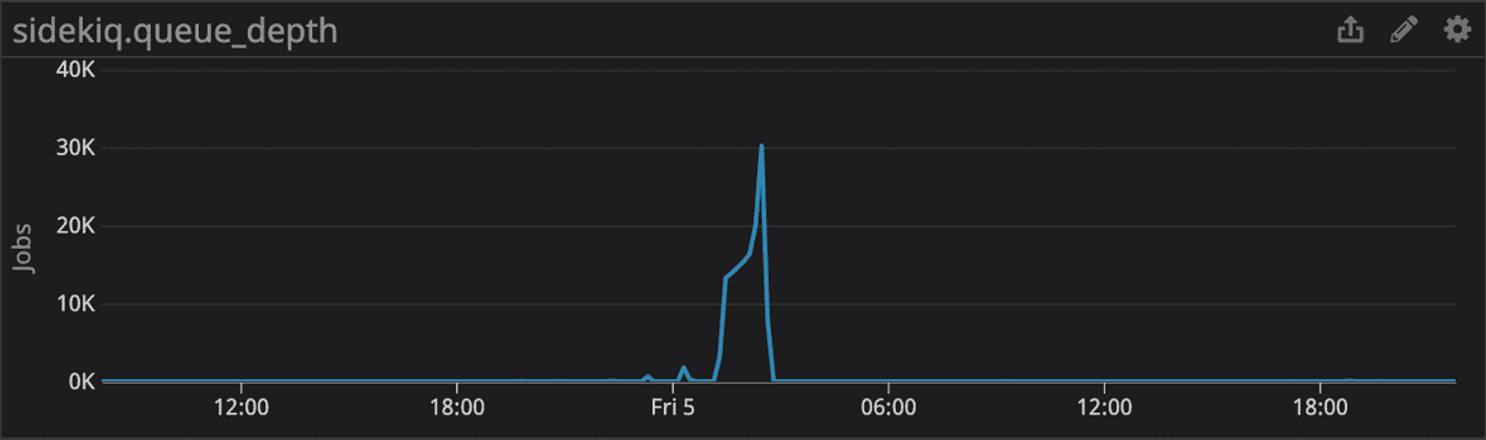
2021-02-04 21:27 CloudTrail jobs began slowly consuming background job processing capacity, each one having a small, but cumulative effect on throughput
2021-02-04 21:29 A misleading error was reported by the mutex wrapping our migration process leading to an engineer manually interrupting and restarting the process
2021-02-04 21:27 The index was manually readded but the query remained active as there were still old transactions open with queries performing full scans on the affected table
2021-02-05 00:20 The first actual impact on runbook performance was noticed
2021-02-05 00:32 The performance incident resolved itself while under investigation
2021-02-05 01:15 Runbook performance began to be affected again, more significantly this time
2021-02-05 01:20 It was theorized that the long-running query to add the new index was responsible for the performance degradation and it was terminated. This led to the existing index being dropped again.
2021-02-05 02:35 After consulting with the author of the migration, the initial index was readded, overall background job processing capacity was restored and the work to process backlog of runbook steps was started
2021-02-05 02:42 Requests to app.firehydrant.io begin timing out due to database load
2021-02-05 02:45 Backlog processing completed
2021-02-05 02:48 Requests to app.firehydrant.io are successful again
2021-02-05 02:52 New index is created again but it’s observed that CloudTrail jobs are still consuming a disproportionate amount of job processing capacity
2021-02-05 03:25 Outstanding CloudTrail jobs are terminated and recently created index is used for newly scheduled jobs
Contributing Factors#contributing-factors
Combination of unrelated workloads in a single asynchronous queue#combination-of-unrelated-workloads-in-a-single-asynchronous-queue
While the lack of this index resulted in slower processing of Deploy Event ingestion, it didn’t have any direct impact on runbook performance execution at a database level. Runbook step execution shared a work queue with this Deploy Event process functionality and the lack of partitioning between them resulted in severe delays in functionalities that are only tangentially related.
Vague and potentially misleading error messages during long-running database migrations#vague-and-potentially-misleading-error-messages-during-long-running-database-migrations
A long-running migration raises a scary-sounding exception in production and one’s natural response is to immediately act. If this error were reframed as an informative log message with the error reserved for a truly exceptional state, engineers may not be compelled to intervene.
Inadequate documentation about how to respond to issues during the migration process#inadequate-documentation-about-how-to-respond-to-issues-during-the-migration-process
The safest action to take when a process is experiencing issues in isolation is nothing. There’s no impetus to act and interrupt a migration when there are no other symptoms being exhibited by the rest of the system. If we had better documentation in place and a specific dashboard showing the important metrics to watch when migrations are in flight, engineers could rest assured that their operations are proceeding safely.
Missing monitoring of work queue latency#missing-monitoring-of-work-queue-latency
We have monitoring around work queue length but were missing an alert on the latency of jobs in the queue. Hard thresholds on queue depth aren’t effective for us as a low threshold wouldn’t capture a failed state during periods of low traffic and high traffic would result in noisy and inactionable alerts.
Response Plans#response-plans
Improved monitoring#improved-monitoring
We’ve added a metric and alerts for queue latency (delta between job creation and completion timestamps) along with an alert for steadily growing queue depth.
Improved documentation and training around migrations#improved-documentation-and-training-around-migrations
While engineers who have worked at FireHydrant have a solid understanding of how our migrations are managed, that can be considered to be institutional knowledge at this point and we will work to document it. Most migrations are automatically applied safely and without incident, it’s still important that engineers understand what’s happening underneath the covers and have a documented process to follow when investigating anomalies in their execution.
Isolation of functionality types in background work processing queues#isolation-of-functionality-types-in-background-work-processing-queues
We’ve partitioned some of our background job processing into dedicated queues but this incident exposed opportunities to expand on these efforts. Multiple people in the FireHydrant engineering organization have experienced incidents stemming from excessive isolation between work queues but we’ll work to strike a reasonable balance given our multi-tenant architecture.
Automated checks on potentially unsafe migrations#automated-checks-on-potentially-unsafe-migrations
We’ve historically relied on engineers to know which actions are safe to apply in migrations and then for their peers to catch things in the code review process. There’s tooling (https://github.com/ankane/strong_migration) in the Rails ecosystem to identify some of the common dangerous operations and we’d like to provide automated guardrails around these through our build process. We try to delegate the majority of automatable checks to tooling, freeing our engineers to focus on deeper reviews of the changes.
If you have any questions about this retrospective, please reach out to support@firehydrant.io.